Pages

Monday, 30 September 2013

Short GBP?

The UK macro picture has improved hugely in the past 6 months, forcing interest rate expectations up hugely as shown by the shift in 3M LIBOR expectations.

UK historical STIR curve from Jan vs real time and spread in red.
This view is supported by the very strong PMI readings and decent labour market readings, all in all the near 10% rally in the GBPUSD over the past 2.5 months has had a strong macro footing, However I see it unlikely to keep pace and there are starting to be signs from the Credit markets that this is the case.

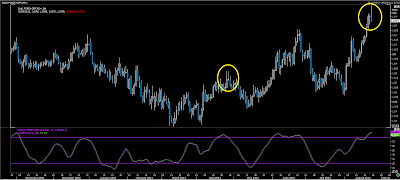
GBP technical view, Citi Macro surprise middle pane, Stochastics bottom.
Here we can see that the GBP is running into 5 year resistance and strong supply above 1.62 through 1.6250 and this will definitely slow progress higher, this combined with overbought stochastics suggest upside is limited for now.

There was also very large volumes in GBP today (possible distribution top?)

Reuters Matching relative volume


This week we have important PMIs and I have a feeling that they'll disappoint, especially considering their strength of recent months that sort of momentum will be hard to keep.

Furthermore the aforementioned Credit view is seen here, the GBP vs (UK vs. US) yield curve spreads

GBP vs GBP model, large divergence occurring now

As we can see there is a lot of resistance for the GBP and the path of least resistance is lower - plus I don't mind holding long USD at this point, so that's why I'm in GBPUSD shorts as opposed to EURGBP longs.

Here is a quote from a Goldman Trader on today's Moves

"The most widely telegraphed flow of the year later this afternoon and no surprise cross trades softly - aided by the general risk off tone and political instability (although hardly new) in Italy over the weekend. My inclination tells me cross won't collapse from here and if anything we should be looking to reduce longs in sterling at these levels - cable should struggle to break 1.62 while EURGBP, although technically looking vulnerable below 0.8350 has severe snap back risk later today with month end also confusing the issue. We still like sterling but not at these levels and the easiest trade right now feels to observe and wait but risk reward here and now is to be short sterling tactically."

My trade is as follows - Short GBPUSD at market 1.6190. SL on a close above 1.63 with targets around 1.59


In other news.... BTPs had an exciting day lol


Wednesday, 18 September 2013

Big moves in the Fixed income markets

So the headlines were as follows from the FOMC

*FED SAYS ASSET PURCHASES ARE NOT ON A PRESET COURSE AND FED DECISION ABOUT THEIR PACE REMAINS CONTINGENT ON ITS ECONOMIC OUTLOOK, LIKELY EFFICACY AND COSTS

*FED SAYS TO KEEP BUYING $85 BILLION IN BONDS PER MONTH, SPLIT AS $40 BLN MBS AND $45 BLN TREASURIES

* FED SAYS TO KEEP FED FUNDS 0-0.25 PCT AS LONG AS JOBLESS RATE ABOVE 6.5 PCT

*FED SAYS RECOGNIZES INFLATION PERSISTENTLY BELOW 2 PCT COULD POSE RISKS TO ECONOMIC PERFORMANCE, BUT ANTICIPATES INFLATION WILL MOVE TOWARD OBJECTIVE OVER MEDIUM TERM  // hints of Japan?

Either way - what we got here was far wide of consensus which was for a $10bn cut in tapering split equally through MBS' and UST's. But this is clearly not going to be considered until December now.

First off, clearly UST's were going to benefit hugely and we saw the 5's yield drop the most (in terms of bps) since March 2009


And, in my opinion, more importantly the US 2s10s tightened from ~250bps down to 235bps on the news as the long end was heavily bought, but at the same time the US 5s30s steepened considereably from 218bps to over 232bps


Furthermore in terms of inflation protected bonds - these were very sought after with the 10's ending up over 2%, pushing the yield down from 0.72% to 0.49%


Overall, it's been a big day and in all honesty, with 2 months to go before the next taper consideration, we could very easily see the 10Y benchmark trade lower towards 2.5%


Tuesday, 17 September 2013

Charts that make you go hmm...???

First of here is an almost 20 year look at the Nikkei vs the 10Y Japanese IRS


As we can see, for the past 4 attempt of this downtrend, the IRS (red) has stayed low while equity prices have rocketed up. Is this time different?

Now we can consider the US 10's vs the Dow 30. Makes you think...


On a smaller timeframe - here is the Dow today, vs the Dow of July/August 2011, a very similar H&S pattern forming. Coincidentally both around important Fed moves (2011 was QE2 ending) and we are facing FOMC tapering potential tomorrow so who knows??

Wednesday, 4 September 2013

2 Year bond yields

The importance of short term interest rates on the FX rates is undeniable and quite clear. Below is a YTD chart of the yield differential between the Us and German 2 Years vs. the EURUSD

EURUSD white, USDE2 spread Purple. Thomson Reuters

But we are at a very important point in the yields as we go into possibly the most important NFP of recent times. The consensus is a strong NFP (>175k) will be met with a guarantee of tapering in September as opposed to later on. 

But where does this put the Yield spread as this will have enormous influence on the FX rate, as we can see the US 2's broke above the two key levels approximately at 0.44%.

Us 2 year yield. Bloomberg

As we can see, there is definitely potential for the the yield to move higher, possibly to 0.5% and even higher.

But when we consider the Germans then it seems the ECB is the limiting factor for now

EUR EONIA 1Y1Y forwards. Bloomberg - H/T Nordea research.
As we can see by the EONIA forward, the ECB refi rate seems to be capping any further advances and this has a clear impact on the German 2 year yield as we can see below

German 2 year yield. Thomson Reuters

So what we can conclude is that from this is that we can see the German yields will struggle to move higher (although if tapering does occur I expect it to still break higher, just with more momentum).

And so if we get a much higher Us 2 yr yield ~0.6% by October is entirely possible. This, given recent correlation would imply a EUR/USD of approximately 1.2750.

As it stands I'll go into the "Septaper" event Long Schatz and short US 2's. As it stands now, the "price differential" on the futures is 0.3766. I am looking for a widening to 0.65 differential.

By buying FGBSc1 at 110.27 and shorting TUc1 at 109.89 (decimalized ofc) 

At the same one could consider hedging by buying EURUSD


Saturday, 31 August 2013

USDCHF, EURCAD and GBPCAD update

Previously, I shorted the EURCAD and GBPCAD. Now around a week later, I'm covering these positions for a very nice level of profit.

Below we can see the two charts and the short entry positions highlighted by a horizontal level

EURCAD


"The first chart - 4 hour - shows how the EURCAD has become overbought on slow stochastics and in my opinion we are due a test of  1.392 in the not too distant future." From here

As we can see the ~0.9% drop came very quickly and ended up being a pain free, simple trade.

GBPCAD

Furthermore, I covered GBPCAD when EURCAD reached my 1.3920 target and unfortunately due to BoE Carney's speech and the movement in the EURGBP this trade only returned 0.7%


Overall, These shorts played out well, and even though the bottom of the move (so far) wasn't reached by my trade it still had little drawdown and good return profile.

USDCHF

This trade was is all about a good idea but poor timing, while it still returned 0.57% in the end, the returns would have been ~3x this had I been patient with my entrance.


Saturday, 24 August 2013

EURCAD and GBPCAD charts

First off a look at EURCAD

The first chart - 4 hour - shows how the EURCAD has become overbought on slow stochastics and in my opinion we are due a test of  1.392 in the not too distant future.


Next we move to a daily chart which has been annotated with various trendlines to show areas of support and resistance, what we see with the daily doji candle, it appears on a failed breakout of a long term trendline showing lack of momentum with the recent move higher and therefore a drop off is likely


finally a look at a longer term view, I've included a fair value model (loosely based on Citi's) which shows (based on yield curve spreads) where the EURCAD should be trading.


As we can see, while there are often divergences (2011) the two come together, and as it stands the EURCAD is far above the fair value model.

Similarly with the EURCAD, the GBPCAD has seen a strong daily reversal pattern emerge.


Circled, can be seen the last time this pattern emerged, previously the GBPCAD fell, but what we've now is a much greater magnitude move higher and so combined with the stochastics, there should be a much greater move lower.

Next on is a longer term look at the GBPCAD and we can see that price tested the ceiling that has been in place since 2010 and failed spectacularly.


Overall, from what I see here there is strong evidence to short both EURCAD and GBPCAD - personally I'm already short, but of course I still believe it is a strong opportunity from here and so would advocate shorts on the open during NZ tomorrow and look for a move lower, 1.385 in EURCAD and 1.61 GBPCAD.


Monday, 19 August 2013

Time to get long the dollar

With the bond markets fully expecting the tapering to occur in September, with 10Y benchmarks at the highest level in 2 year, it is somewhat surprising that the FX markets are seeing an almost opposite scenario playing out. The USD has been one of the weakest currencies in the last month but now as we head into an FOMC meeting this Wednesday and further ahead into the likely tapering in September.

What we see therefore is both a technical and fundamental play for the USDCHF pair. Combining this bullish USD fundamentals and then the following technical levels.


As we can see here, the USDCHF is building a rather clean, impressive Inverse Head & shoulders formation. Stochastics lay in the oversold area and are showing signs of moving higher. Below we see a daily chart and can see how there is a strong supporting trendline which will act as our stop level.


Overall we can see that a long at 0.9250, with an initial target at 0.94, and from there 0.96 seems like a sensible trade to potentially get the best of the fundamental shift towards USD.

As always, a protective stop on a close below 0.9175 is recommended.