First off a look at EURCAD
The first chart - 4 hour - shows how the EURCAD has become overbought on slow stochastics and in my opinion we are due a test of 1.392 in the not too distant future.
Next we move to a daily chart which has been annotated with various trendlines to show areas of support and resistance, what we see with the daily doji candle, it appears on a failed breakout of a long term trendline showing lack of momentum with the recent move higher and therefore a drop off is likely
finally a look at a longer term view, I've included a fair value model (loosely based on Citi's) which shows (based on yield curve spreads) where the EURCAD should be trading.
As we can see, while there are often divergences (2011) the two come together, and as it stands the EURCAD is far above the fair value model.
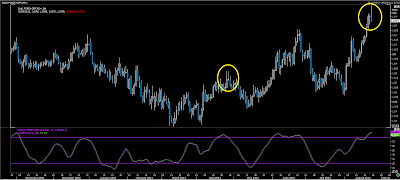
Similarly with the EURCAD, the GBPCAD has seen a strong daily reversal pattern emerge.
Circled, can be seen the last time this pattern emerged, previously the GBPCAD fell, but what we've now is a much greater magnitude move higher and so combined with the stochastics, there should be a much greater move lower.
Next on is a longer term look at the GBPCAD and we can see that price tested the ceiling that has been in place since 2010 and failed spectacularly.
Overall, from what I see here there is strong evidence to short both EURCAD and GBPCAD - personally I'm already short, but of course I still believe it is a strong opportunity from here and so would advocate shorts on the open during NZ tomorrow and look for a move lower, 1.385 in EURCAD and 1.61 GBPCAD.


No comments:
Post a Comment