Depending on where you read, the chance of Taper centres around early 2014. However the various asset classes show a very different, individual picture.
By looking broadly at the major few asset classes we can see how to best position for the "inevitable" Taper. Throughout this we need to remember that going into the Sept 18th the market was positioned such that Tapering was expected - the market was surprised, but we can use those values as a benchmark to compare to now.
Firstly, Gold (GLD) -
The precious metal has been incredibly weak (spot ref, 1242) recently, down 10% since the Sep 18 no taper FOMC announcement, roughly the same loss since the first major mention in June.
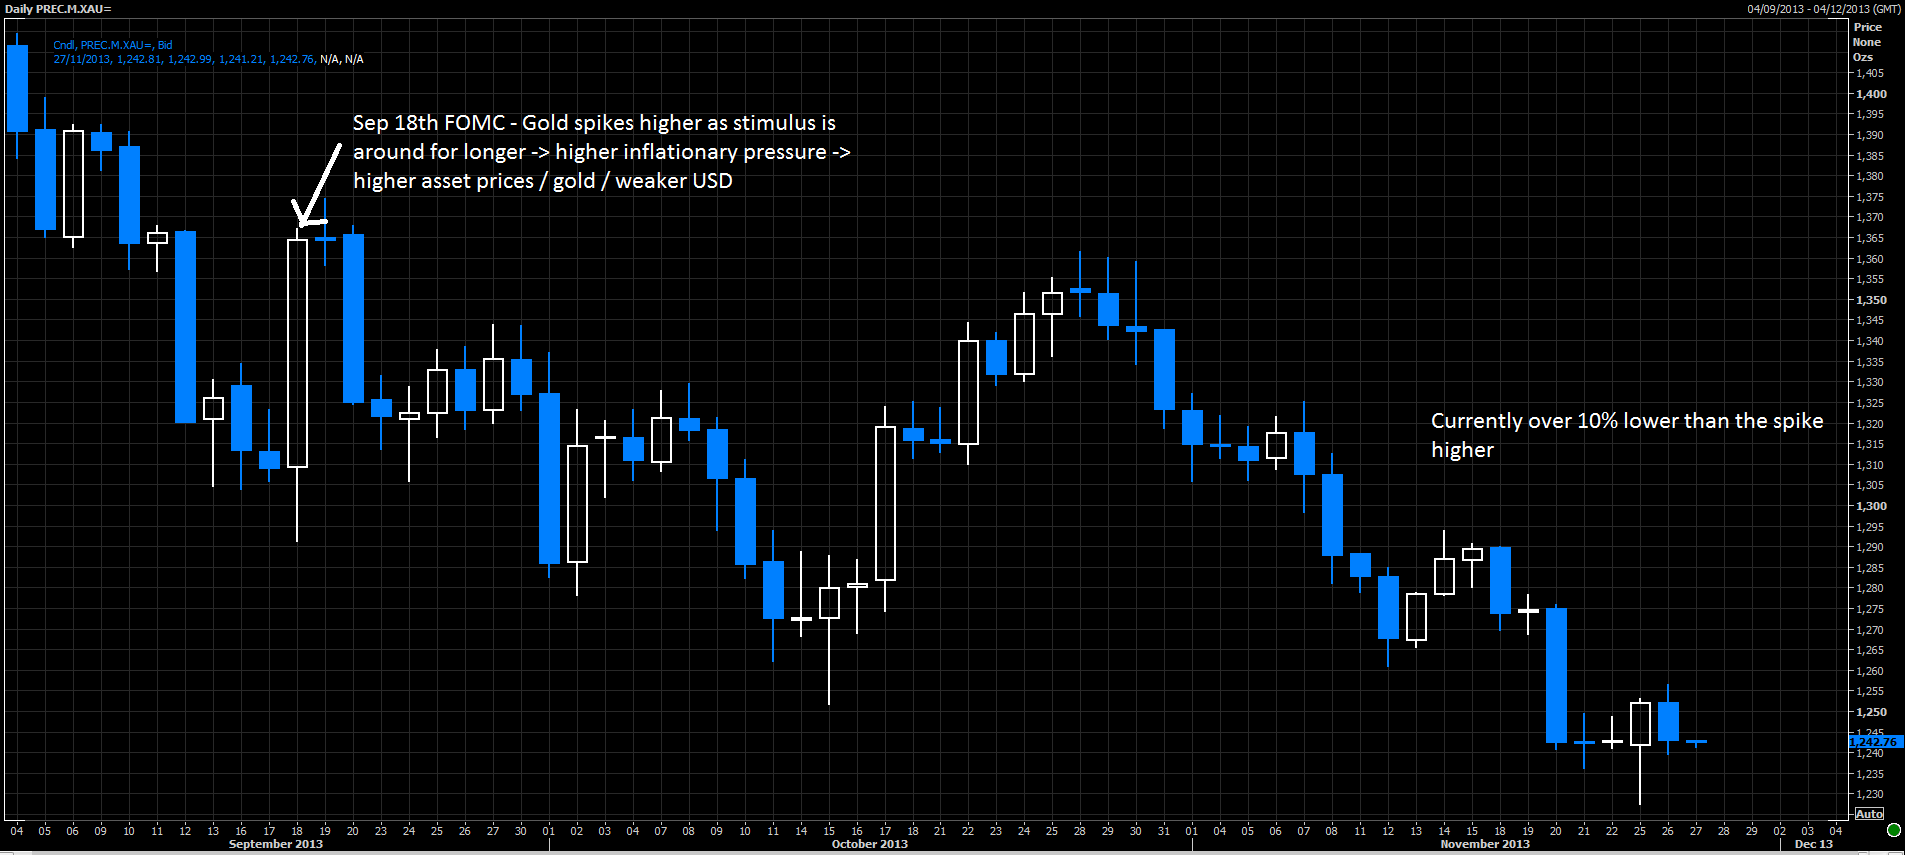
The fact that the gold price has been so depressed shows that, at least commodity traders, fear that tapering could be very soon. In fact the delay in Sept. hasn't changed much and we will still head much lower.
US Treasuries, (TLT/IEF) -
However, UST yields, which would broadly do the inverse of gold regarding tapering are currently 13 bps lower than Sept 18. This to me suggests that the Fixed income markets see Tapering being less likely and the direct buying of USTs and MBS from the Fed has pushedyields lower. In fact for not one instance has the US 10 year yield traded at a level seen at the Sept 18th FOMC meeting.

However the Belly of the curve - the US 5s have dropped in yield far more than the 10's. This is because the 10s price in a guaranteed tightening cycle where as the current 5s may just be on the edge and as such the yield has dropped much more since (I'll touch on this more later)
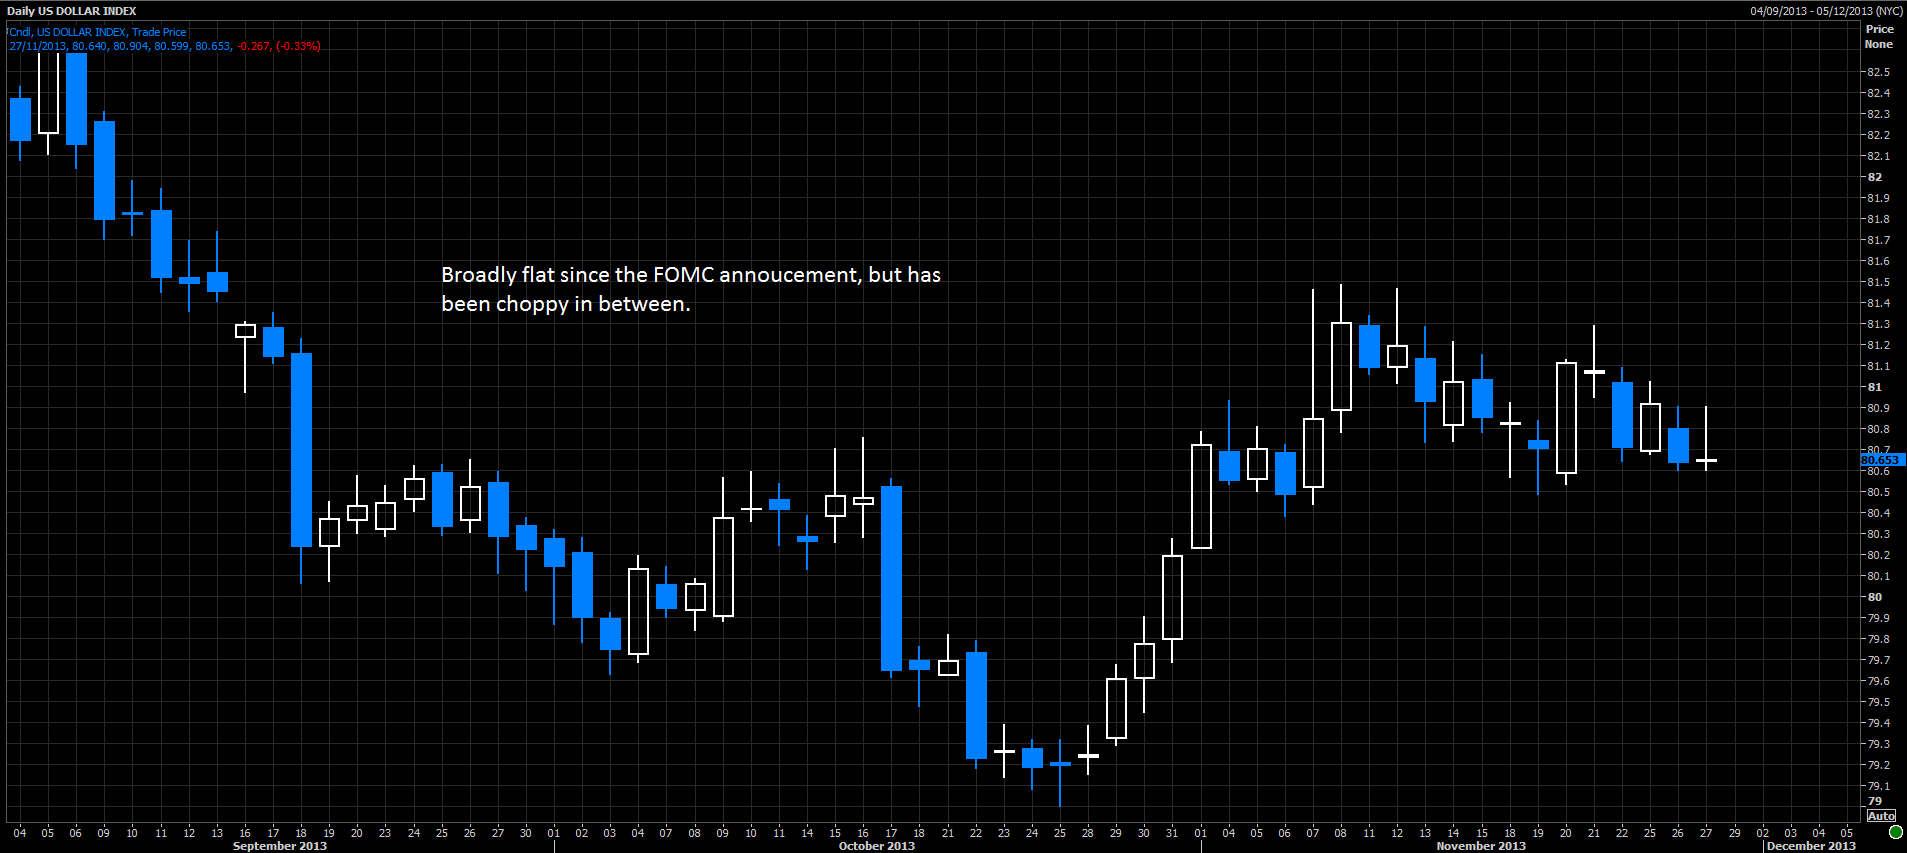
The USD, (UUP) -
Of course, after the QE program was continued in September the USD reacted poorly. But since has recovered nearly all the loses since then and is trading at around 80.64 on the Dollar index (DXY). We must remember the weighting of the constituents for the DXY as the EUR is over 50% and we saw a rate cut there, and the JPY has had further BoJ intervention (talking mainly). So we can judge that the USD as a whole is broadly a touch weaker since the FOMC, roughly to the same extent as the bond markets. 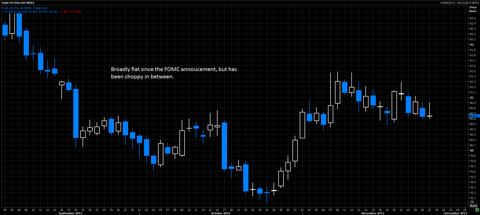
When we consider these 3 asset classes combined, the so called FICC (Fixed income, currencies and commodities) we see that when we scale the chart to the Sept 18th FOMC day there is a large variance in performance as shown below
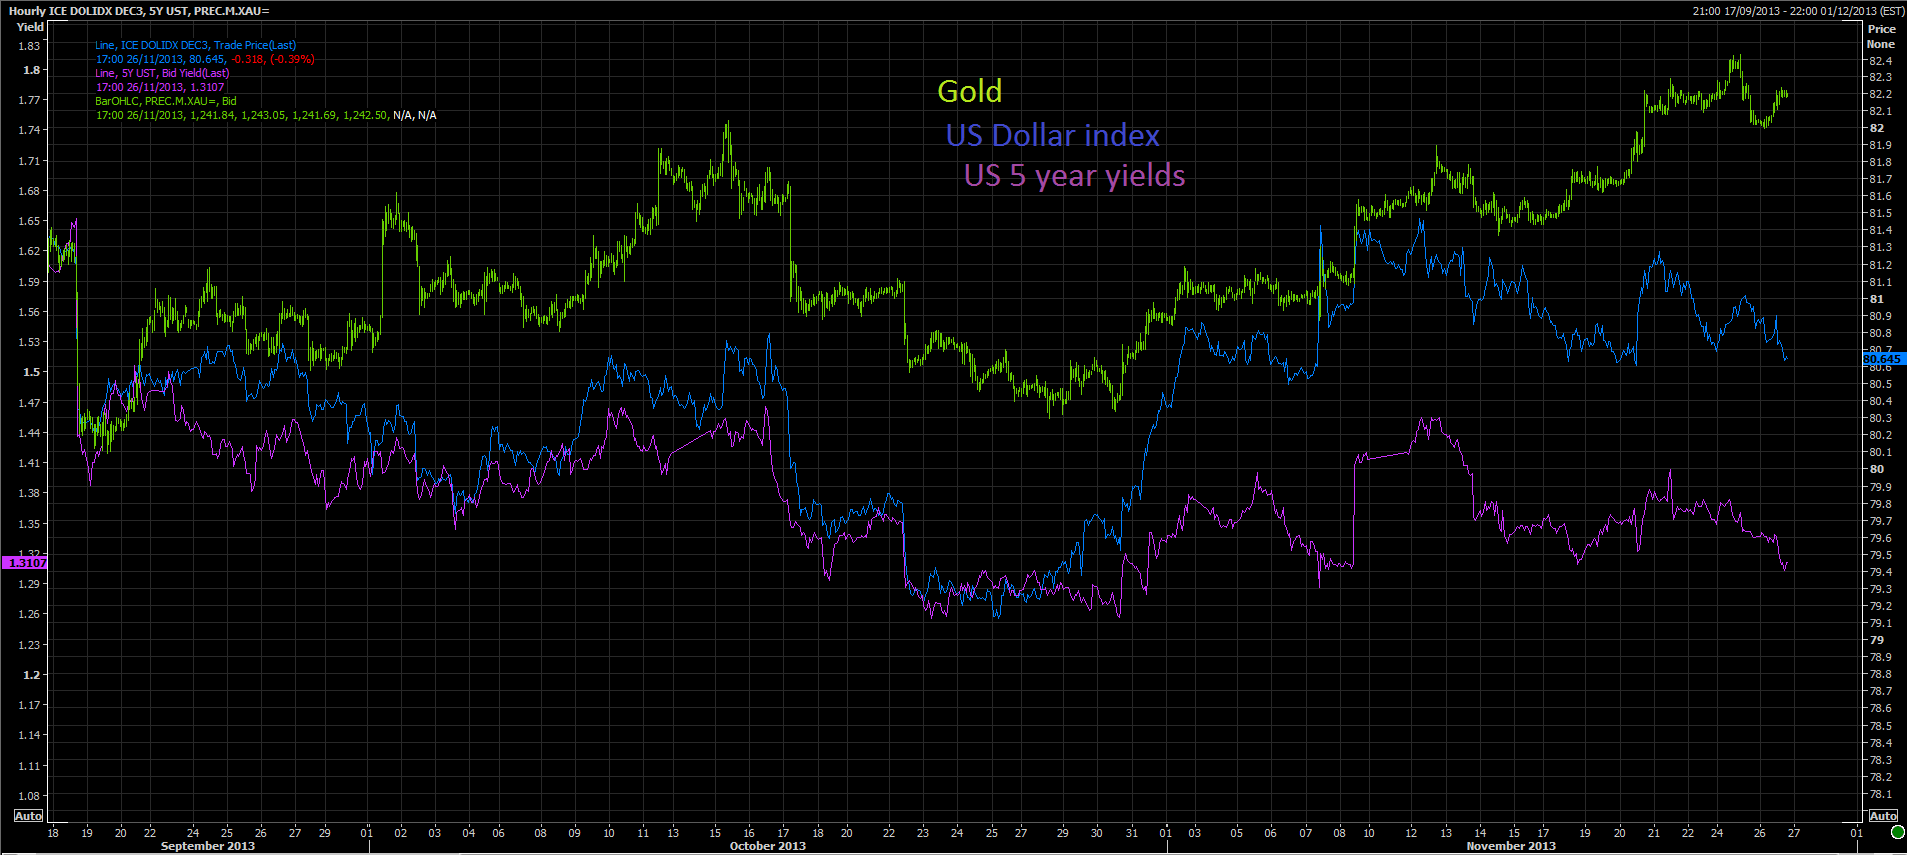
So, How I interpret this is as followed:
Gold is lower (on the chart it is inverted and green) since Sep 18th suggesting that Tapering is just around the corner, and as such a strong NFP will result in a December Taper.
US Dollar index is barely changed pricing in tapering, but not as much as gold - so suggests the consensus view of January 2014 for Tapering to start
US 5 years are much lower, suggesting the belly of the curve isn't buying into the taper idea any time soon and it has dropped off subsequently. This in my opinion would be pricing in a March or later Taper.
So the gameplan for me going forward is that to position into December and year end would be to Short US 5's, via futs, cash, etfs etc (just get long interest rates) and to simultaneously be long gold. This would mean that if there is a surprise and we see a December taper then the losses on Gold should be less than the gains on Short USTs because of relative values at the moment. If the opposite were to occur then Gold would rally significantly and USTs would only rally a bit (therefore a hedged, well risk-adjusted profit).
At this time, staying vigilant on the USD and being short USTs / Long gold would work well ( maybe long 1 GLD while short 2 TLT or something to this effect).
Thanks for reading, Good luck.
Jeremy.
No comments:
Post a Comment