Pages

Tuesday, 21 April 2015

FX & Rates thoughts - April 22nd

Markets are all very interesting right now, we are living in interesting times and there is a lot that we could look at. However, I am going to focus mainly on the UK election, the GBP and related assets. Although there are certainly some ideas that we are going to look at in EUR rates markets and ultimately the EUR fx rate.

Firstly, the UK election is now just 2 weeks away and its all starting to get very exciting... or maybe not, I'm not too bothered.. I am finally old enough to vote, however I don't have the best political knowledge and while I have a rough idea on how the election is going to play out, there are plenty of uncertain outcomes that are entirely possible.

We have already seen the markets react to varying polls, just like with the Scottish referendum. After one poll from the Guardian suggesting the Tories had taken a bit of lead we saw an immediate bid in the GBP. This acted as a good sign to me as to where we stand going into May 7th... However currently the bookies (paddy power) favourite is a for Labour Minority. All this uncertainty is what has led to heightened implied volatility in the GBP relative to other currencies as shown below.

GBP-FX composite 1-month implied vol
We can see 3 distinct peaks in this chart.. 2010, Sept 2014 and right now, and these all coincide with election risks, and just like before this heightened risk premium will most certainly fade in a few days after the election.

GBP riskies vs basket
However conversely to ATM implieds, the skew is much tighter than the prior two spikes (on a basket weighted basis, i.e. not just GBPUSD riskies).

So far this year, the GBP has performed well, so long as we don't fund it in USDs or CHF. One of my trades of the year for 2015, was buying a basket against varying currencies and as we can see below that it is up around 10% against 3 of the funding currencies and down 5% against the CHF, so as an update it is all going rather well.

GBP vs CHF/SEK/EUR/AUD
Looking forward, I think we do have a sizeable chunk of election risk premium priced into the GBP, I would argue a good few percent. I think the market learnt its lesson from the Scottish vote and more efficiently priced in the risk.

GBP vs Z5 STIR spread
Short term interest rate spreads have diverged meaningfully from Spot FX in the past few weeks. Here we chart L Z5 - ED Z5, or Dec 2015 LIBOR futures. This simple overlay would suggest the GBP is around 1.55 and of course its a huge simplification however its clear hedging election risks is most straightforward in FX and this is represented above.

Whilst there is uncertainty in this election, and I don't think anyone would disagree with this, its hardly as if there wasn't in 2010. The 1st time we had a coalition must've come at a shock to many, and rightly so the GBP was vulnerable, however only for a day or two.

GBPUSD May 2010 and DXY

TWI GBP May 2010
What I hope these two charts demonstrate is that, yes, the GBP was weak for the odd day, but most people (looking at you Sell-side) have been charting cable mostly, but we can see from the top chart that this was mostly dictated from USD moves. If my memory serves me, the US flash crash was very close to the UK election and this of course impacted USD pairs hugely. The TWI GBP is far more useful and we saw merely a flesh wound on the day within a strong up-trend.

Now of course I'm not looking to make a prediction of who is going to win... I really don't have a clue, however to me its clear that a fair chunk of risk premium is priced into options markets and spot FX although the past has shown us that even a shock result is necessarily doomsday for the GBP. We have these (imo) outlandish forecasts from the likes of MS, BNPP and barclays seeing the GBPUSD at about 1.4 by Q2 end, not something I really see as too likely unless the USD really gets a kick. In honesty I think the election will most surely result in stupid intra-day vol but in the grand scheme of the GBP (and related to its key drivers) I don't actually see it as too important.

Looking at the BoE/UK economy, sure, we can easily argue that the BoE missed the hike window and now we are pricing in another 14 months (MSM1KE) till we have that elusive 1st hike.

UK PMIs

GBP 5y5y inflation swap
Looking at most UK macro data pieces, the situation certainly isn't atrocious. PMIs are strong, the Labor market is not bad at all, real GDP at a steady 3% looking forward, Europe possibly turning the corner... all is good, right? well there are still some niggling issues, such as 0% CPI and wage growth, but ultimately I think the UK economy is still strong and has a strong outlook. I do apologise for the 5y5y chart, but if Mr Draghi uses it, there is enough reason to think that it may appear as one of the inflation indicators for Mr Carney, and well it sits fairly comfortably at 3.2%, far more anchored than say the Europe equivalent.

The last time I wrote about the GBP was a couple of month ago and I suggested a 1x2 put spread with spot around 1.54, and the max payout at 1.5... today we stand with spot pretty much at 1.50 and expiration in just over a week I've decided to cover this for a very nice return.

And from here, I'm looking to rotate into a long GBP risk reversal. Long 1.54 calls and short 1.42 puts. The rationale is that if the election passes and the result is acceptable we should see a bid across the GBP and the gap highlighted earlier will likely close. On the other side, even a shock (like 2010 was) may jolt the GBP lower, but it doesn't change the raw fundamental drivers for the GBP at least in the 3 month horizon and given the skew in implied, this structure is pretty much zero cost after fees/spreads.


Now looking at Rates, I've been reading much more on Swaptions, so I decided to look into a possible trade idea here.

EUR and NZD 1yf10Y rates
Global rates, as we've discussed plenty of times before are well anchored in this low inflation / high easing world we live in.. Here we see EUR and NZD swap rates (10 year 1 year fwd). With EUR rates, I get amazed day-by-day by the interesting world we live in, with negative Bund yields out to 9Y, and negative 3m EURIBORs etc etc, however I do think that the upward impulse in euroarea growth in the later half of the year will be enough to keep the 10Y rate from 0%, as such I am looking to sell 0% strike receivers with 1y expiration. I read an interesting piece from Soc Gen last week about the increase in implieds at the 0% strike and lower due to difficulties hedging and pricing these options, and so selling these looks good. The premium is around 4.4bps here.

Bill Gross came out today and suggested shorting 10Y bunds here, suggesting we could see a 10%-15% return from doing so.. a EUR 10 y swap currently costs about 2bps in carry/roll (mostly roll these days) per 3 months, so while I'm not overly keen on the exact timing its hardly an expensive short. On top of this, if we assume bunds won't go much lower than -0.2% for 10years, which is truly ridiculous given the whole macro situation in my opinion, then price appreciation is limited to a few % at most... so from a risk:reward its starting to make more sense. I've been in a long UST/ short bund trade for a while and its performing okay thus far, however I grow more confident in this, with EUR rates acting as an anchor and any EURUSD dip acting as demand for USTs.

USD -EUR 10s spread


With this premium, I look to buy receivers in NZD 10s. We currently trade at 3.775 and I think we have the potential to head much lower.

RBNZ 1 year expectations for OCR 
the market sees 25bps of cuts from the RBNZ over the next 12 months, however given the weakness in inflation, slowing growth, declining milk prices, very strong NZD we could see further dovishness from NZ. This makes me like the idea of receiving NZD rates, but buying a 3.42% receiver costs ~10bps.

NZD TWI
the NZD TWI traded new highs just this week! RBNZ won't be very happy...

The one obvious concern for the RBNZ is house price growth, which would be further fuelled by a move lower in the OCR to say 3%, however I think that this would be worth the benefits.

House price index
Overall, selling 2x EUR 1y10y 0% recievers per NZD 3.42% reciever is zero cost (ex fees) and positions me well.

One final quick look is on CAD.

CAD vs Oil
As shown from the chart above, we are clearly still in dynamic whereby oil prices are determining the CAD for the most part. Oil is up some 20% from its lows a few weeks ago, however one would expect heavy offers on these rallies, producers that are losing around $50 will be frantically locking in these prices, and increasing capacity limiting Oil's gains. From a technical perspective there are arguements to be made for a run through 60, however generally speaking Oil will be pressured, and as such so will the CAD.

Given the rationale earlier for the EUR rates, and the recent discussions we've had on European macro and the potential for a strong year, long EUR exposure is something I have been building these past few weeks. EURCAD therefore looks attractive, alongside EURNZD (given the reasons above)

EURCAD

Anyway, its getting late (/ early...) so thanks for reading, feel free to discuss etc. and if you're in london, do come to the Thalesians talk on global macro next wednesday! should be great!


Sunday, 29 March 2015

April FX & Rate thoughts

Another month... more of the same, we saw the USD index trade up through 100 before reversing and slamming lower (currently 97.5), also persistent underlying strength in the UST market with 10 year yields firmly back below 2%. It also highlighted some under-performance in euro-area peripheral debt markets - Italian benchmark 25bps up from the lows.

Central banks remain biased towards being dovish, in part through marginally lower growth expectations but mostly through the continued disinflation. Still in part to the likely transitory impacts arising from the drop in oil we've seen.

2y inflation swaps, top-> bottom, GB, US and EZ

However when looking at market expectations, whether its because of further monetary easing or otherwise, there has been a noticeable up tick in inflation expectations (excluding the UK). 2Y EZ HICP swaps trading 50bps higher YTD.

This is important I believe, as it brings into question the likelihood that EGBs stay incredibly low. Further to what I looked at last post here, I still think there may be an opportunity in the not-too-distant future to position for higher EUR rates, not necessarily on the short end, but most definitely in the long.

A much thrown about chart in the last few weeks is the relative economic data surprises in the US vs Europe.

Citigroup economic surprise indexes
There has been a rather stark, almost equal and opposite move in data surprises. Which I can only really put down to the large move in EURUSD, data strength has been exported from the US right to Europe when it needs it most (kinda).

So right now, we've got a low EUR, decreasing real rates in Europe and QE... argue as we like about the possible success of QE programs, the environment is rather good in Europe for outpeformance and stronger growth.

This is highlighted from the BAML fund manager survey chart below.

So what does this all mean for us then... well I think this is supportive for European Equity for starters, but that doesn't come at a surprise, with the Dax up some 20% YTD. What is important about this is that all these inflows into europe have been currency hedged. So for every purchase of European equit, ETFs/fund managers have been selling EURs keeping it pinned lower. The question really is, 'at what point is the EUR cheap enough for portfolio managers to remove / have no ccy hedge'. I can't pretend to answer that, however without being overly presumptuous, most sell-siders have been targeting parity (or something lower) and with that around 10% lower I think the somewhat /lazy/ PMs will probably hold off for now against removing these hedges.

Furthermore we have the remaining issue of USTs yielding significantly more than EGBs, last time we saw the 10y swap spread at 1.6% and I suggested buying USTs / shorting bunds. We stand today at 1.48% and my convinction on this trade is growing. Not only in part from the bids into the UST complex, but also the possibility that long end EGB rates could rise.

I really like this bond pointed out by @macrokurd

Austria 2062, currently trading at a ridiculous 210. Ultra long duration and a prime candidate to short.. but lets be honest, I still wouldn't want to fight the overwhelming yield demand, but 0.9% for an almost 50 year bond.. come on! its gotta end soon!


More simply, do you short bunds? probably not. or at least not yet. How many times has it got to levels where 'it can't go lower!!' yet still does..

So what? Steepeners? hmm.. maybe, but difficult to decide where, steepeners in the 5s10s sector may work, EUR 5s10s swap is currently 30bps,

Or do we look to Euribor futures? - well here we have June 2018 implying 26.5bps, 2017 at 9.5bps. If we do see, as I expect, an uptick in Eurozone data then it's possible to see this curve steepen somewhat.

Another market that could be interesting to us is New Zealand.

We have an economy growing nicely, but a central bank that has just hiked the base rate by 100bps, and a market that has rapidly priced out further hikes accompanied by RBNZ dovish rhetoric. They still bitch and moan about a higher currency, and while the NZDUSD is far lower.. on a Trade weighted basis the NZD is still strong. Importantly, the AUDNZD, all time lows just above parity is key, and I think the RBNZ will continue on a dovish bias.


The RBNZ has hiked before and cut, nothing stopping them again.. I am sure, with inflation ticking lower we could potentially see a scenario (much like the RBA/BoC) where the bank cuts rates in a pre-emptive manner.

Combining the last two ideas, we can foresee a situation which would be beneficial for EURNZD

EURNZD vs 2y swap spread
There has already been a large divergence, and if yield spreads tighten then it should be supportive for the cross. It's hard to know why there has been such strength in NZD relatively, I mean firstly its hardly like volatility has dropped, if anything its much higher and heading in 0.8 direction (lol).

Just RFQ'd on a 6 month 1.50 digi call with 1.40 KO and it comes in at 28%. almost 4:1 risk reward ratio, though a 1x2 call spread may also look attractive.


Lastly, on the Fed. Whilst I was skiing, Yellen and Co. came out with what was seemingly a largely dovish move. FF futures and ED really struggling to make their mind up.. aimlessly wandering until NFPs or other good data comes out to suggest a strong US economy. Alternatively whenever the Fed speaks the futures leg higher (FFZ5 up around 12bps since Yellen).

It's funny, even if US data has disappointed expectations (as per CESI), its hardly bad. The Labour market is still strong, a solid 2.2% Q4 growth rate confirmed last weeks, PMIs doing fine... so Fed, what's the problem? To me, the economic picture is not drastically different to when the Fed was comfortable with a June Hike, and the removal of patience indicates we are close to that first hike. If we are then ED steepeners look good, alongside my short sterling steepeners.

EDM6-M7
A mere 2 and half hikes between june 2016 and 2017... if the Fed is serious about normalization, then I think we would see more than this.. however I'm not in this trade to see this realized, I think the curve is too flat given the state and outlook of the economy, and while the USD may be acting as a wind-break to US macro, its not a major game changer imho.


Monday, 9 March 2015

March FX & Rates outlook

There has been a lot of discussion in the past few months all about negative rates in Europe/Denmark/Switzerland, however I think what is more interesting is to consider the impacts on the Bund curve, against say, JGBs. Japan has obviously struggled with deflation for many decades now, whilst its a relatively recent wave hitting the European area. Tho this being said, every bund trades through JGBs across the entire curve!

JGB vs Bund sovereign curve
There are a lot of issues in the Eurozone, from growing Grexit concerns to structural fiscal issues, however I don't believe that we are going into a period like Japan.

This chart from Martin is one of many that show optimism in Europe:


It is of course worthy of note that the wave of disinflation/deflation has been exacerbated by commodity prices, in particular oil price declines, however the basing factor will mean that the impact will disappear from the headline figures over time. And whilst we may not see massive inflation, we may see a definitive pickup.

This might have quite the impact on Bund yields (and other zero-bound rates), primarily those in CEE.

HUF / PLN / EUR 5 year swaps
There has been a sizable uptick in Hungarian and Polish rates in the past few session, and it feels like there may be more pain to come, as even though there may be a global hunt for yields, what we may see is a re-convergence of longer maturity rates.

What I mean by this is that if large global flows are going to be looking for yield, the clearly you'd look straight to USTs. One would much rather own a 10y UST at 2.2%, than polish rates at 2.1% as per above for example, and these flows may act to re-converge all DM rates.

While at the same time the idea that bund yields (and other zero-bound 10s) could actually pick up.. Thus when we see the 10 year USD/EUR swap rate at 160+ bps I think that the upside is rather limited and we are approaching the ultimate highs.. its possible that Fed hikes and upside data surprise may shock this higher, but I don't think we trade too much higher, and considering carry and roll would not hate Long USTs vs short Bunds here.

USD-EUR 10y swap

Looking to FX now, the EUR has been really hit, currently tradig firmly under 1.10, with the DXY storming towards 100. On a technical picture there isn't much support until this channel as per below, around 1.04/05

EURUSD weekly
From a gut-feeling perspective it certainly feels like the EURUSD is situated at a worst case for Europe/ best case for US kinda area, especially given the pace of decline, and while fundamentally the USD is strong, we are way ahead of ourselves - but this isn't new and fading the USD is still too risky. But with the EUR side, positive surprises in the macro picture might start sparking inflows, thus far any flows into Equity/Debt (which are large) have mostly, if not all, been FX hedged. From a managers perspective owning the USD makes sense. Especially given the yield pickup as per earlier, and the "expected" appreciation. But these are flows that are unlikely to capitulate and reverse, so we need new flow into EURs, but from where? don't know. we'll see.

But I think EURAUD could pose a decent short term opportunity at current levels, trading the range of 1.40/1.50

EURAUD vs 5y spread

A potential double bottom here offers good value to get in and play this range, Both via a spot trade for a short term move, and a 1x2 call spread (3 month, strikes ATMF and 1.45)

EURAUD 1x2 call spread
Receives small premium if there is a break lower, and is starts to lose at 1.49 at expiry.

On to the GBP a little...

I posted this trade on twitter last week:


Doing well thus far, with cable dropping towards 1.51, but obviously with this structure my delta flips from short to long if we drop much further so I need to be careful, but its a decent start and I don't think that we see the market getting too ahead of itself into the General election.

GBPUSD daily
Still quite a fair amount of protection being bought into the election (tho I would love to see a riskies composite against many currencies, because obvs GBPUSD is hugely skewed due to USD call demand, and EURGBP riskies skewed due to EUR put demand, so ya know, if anyone wants too then that'd be great :D )

GBP vol premium vs Global
GBP vol premium is fairly minimal, but on a z-score its quite extended against its mean going into the election (this is 3 month vols). But its not at the super panicky Scottish Ref levels yet.

Lastly, I am going skiing next week (yay!) and its a fab time to buy EURs... almost 1.40!

GBPEUR


Saturday, 31 January 2015

February - FX and rates thoughts

Since my last blog post, we've seen a lot occur in the markets. In what was probably the most interesting month since the euro crisis of 2011/2012. We've had more than a lot of policy action, with Surprise cuts from Canada, Denmark, the move from the SNB and of course ECB QE to name just a few.

What is still being banked on across the financial markets, especially FX is the divergence of monetary policy, most clearyl visualized with the 1y1y USD and EUR rates charts as below.

USD vs EUR 1y1yf rates
However what is evident in the long end, and is becoming more evident in the rhetoric from central banks is that the doves are really acting as anchors... And while we've banked on this divergence, it may be far more difficult to materialize.

If we look at 5y5y rates, a basic proxy for terminal rates we can see that, yes while USD and GBP rates are higher, they are being dragged lower by those of Europe etc.

USD, GBP and EUR 5y5yf rates
Thus far, the impact has really only been on long end rates with investors obviously demanding USD rates at 160bps over EUR ones and therefore as EUR rates drop, there is a constant bid underneath USTs. Not only this, but for every down tick in the USD international investors will look to USTs and thus there is a lot of support / interrelationship, even if there is a so called divergence.

But bringing it back to central bank rhetoric, the FOMC mentioned how it has increased its attention of international developments, be it economic data or policy. As such, while the short end may still be chasing this dream of a 2015 divergence, in reality it may be far harder than we first thought.

There has been an uptick in market expectations for inflation across the world, and this seems simply as the last hurdle to overcome before we have hikes, however given the recent central bank action, I am finding it harder and harder to believe the Fed will (or even can) hike rates this summer, with Sept/Dec being far more likely to me.

However this, I think, is probably a transitory reaction function to global central banks - and the fundamentals still remain in tact, so a later / faster hiking cycle is what I look for.

Short sterling vs ED curve


As we can see here, we have Short sterling and Eurodollar curve between M6 and M8, both of which are incredibly flat. EDs back to 2012 flats and SS even flatter!

However, given the fundamental picture that remains in both countries, with strong labour markets / growth prospects and wages being the key drawback - steepeners on both I believe will work. However timing this is key, because so long as people are receiving the long end, this curve will get flatter and flatter, and right now everyone and their dog is loving duration (with good reason), however this a different trade that is just being pushed in the same direction by the flow.

So I've so far argued that the US is less likely to hike given the RoW, but at the same time suggested a steepener.. hmm... contradictory, but like I said, not entering just yet...

Short sterling curve vs 6mo ago
Pretty much every sector of the SS curve is >1% lower than where it was 6 months aog, and there is just over 50bps worth of hikes priced in between summer '16 and '18 which seems to little.

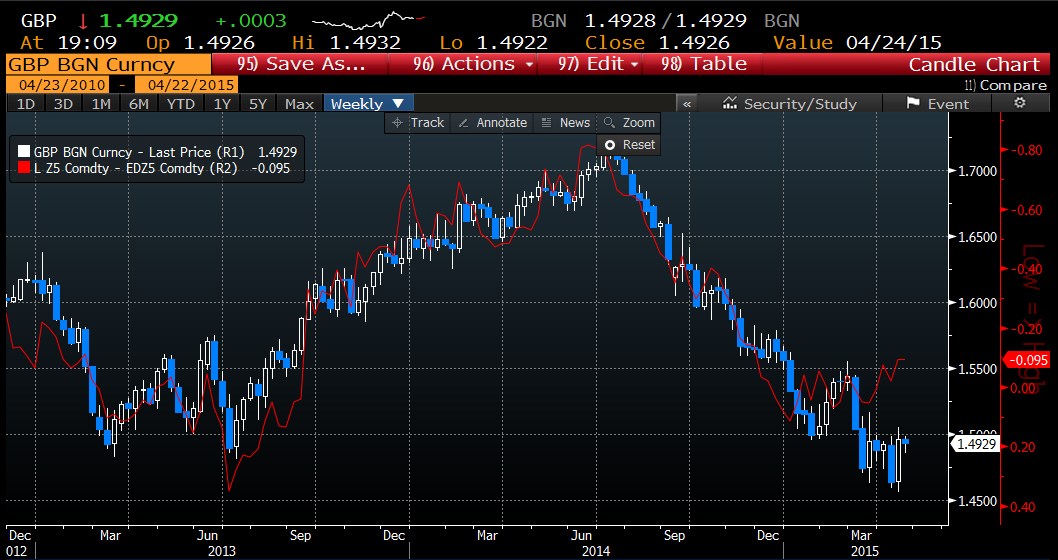
In FX land, the GBP is still being ruled by rate spreads, in a model with variables that haven't been updated in a year now, and still going strong. The biggest variable in this is the 1y1y spread.
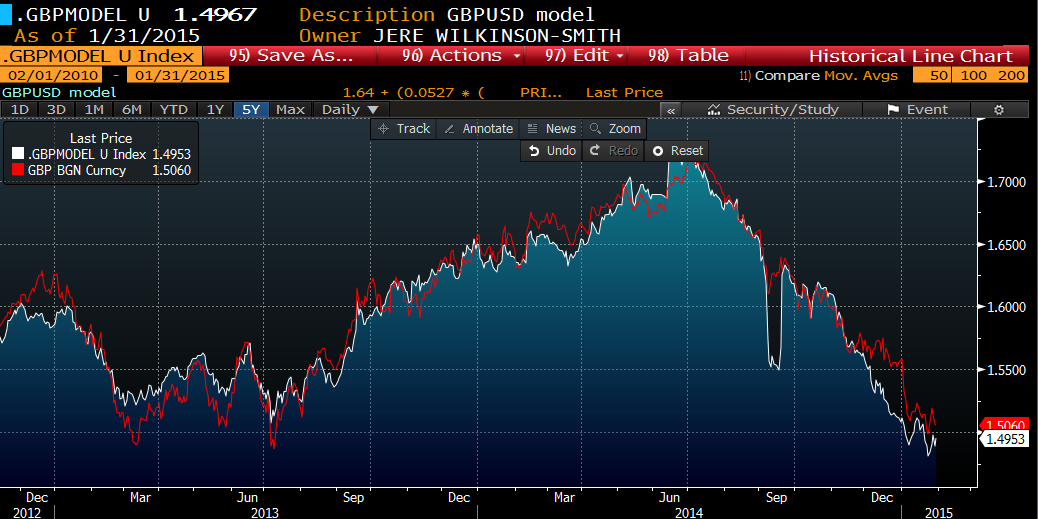
GBP vs model FV
Looking at the EUR, this chart from @Fwred (from credit agricole) shows the resulting move in FX after a QE announcement.


I like this chart a lot, as one would expect the ccy weakens into the announcement, but in 3 of 4 cases (this doesn't include GBP, which in 2012 also rallied post BoE) the currency started to appreciate over the coming couple of months.

EUR-US CESI and EU/US equity ratio
Looking at this picture, we can see that for that European economic surprises have overtaken US ones, potentially the tide is turning somewhat with a possible acceleration from Europe later on in the year and a cooling off in US (much like what happened in the UK!!)

On top of this we see the relative equity performance between Europe and the US, which might result in EUR inflows which was a major factor supporting the EUR in the 2012/14 rally.

So the EUR... reasonably cheap right now, but it is still dangerous to short the USD even if it is getting (wayyyyy) ahead of itself. But 1.20 seems possible to me.

JPY vs nikkei
Therefore looking to fund long EUR in JPY, as currently JPY is a touch expensive to the nikkei at the moment, and coiling for a potential leg higher. EURJPY trades jsut above 130 and to me is good value for longs.

The Bank of Canada shocked us all with a rate cut, though in hindsight, much like Norway seems to make sense with weakening fundamentals and the immense drag of drastically lower (and still falling) oil prices. The CAD has reacted as expected, but it's not something I am willing to to fade, as against rate spreads its perfectly fair.


However, looking at the AUD, we've a tad divergence occuring. In this case the long standing correlation between AUDUSD and 5yr us real rates


Has suddenly diverged...


AUD rates has been heading lower, with the market definitely pricing in rate cuts from the RBA, the recent rhetoric from the RBNZ has flipped from hawkish to perfectly neutral with the 90 day bank bill futures curve flat out through 2017 at 3.5%

It would not overly surprise me to see a rate cut from the RBA, but house price growth is a big consideration here, in any case, vis a vis the USD and JPY I do think that the AUD is getting to be decent value especially as this divergence highlighted above grows... AUDNZD is still a favourite of mine.

Finally a little bit on EMFX, not my strong point, but noticing a few differences in the recent sell-off as opposed to older ones. Spot EMFX is trading lows (as per JPM index), and especially noticeable weakness in TRY / MXN. However, looking at rates, most likely due to the drop in global inflation / core DM rates, we've seen Turkey, SA rates drop meaningfully etc, but unlike other times, the demand in bonds is not at all reflected in a strong ccy.

USDTRY vs 10s
As we can see, in the past TRY sell offs we saw yields spike along side, yet in this case the opposite is occuring for the reasons mentioned above. But the currency is selling off for a reason... and problems exist in EM, however with global funding rates dropping the impact of higher rates is being pushed further back, and as such it might not be that unwise to look to EMFX.

A similar picture in South Africa,

$ZAR vs 10s
This historical picture shows the correlation, but currently $ZAR spot trades 1 big figure higher, whilst rates are 1 big fig lower at 7.1%, thus another sizeable divergence. Considering the supporting factor from lower US / core DM rates, it looks reasonably attractive.


However both ZAR and TRY are at their least attractive levels (based on carry/vol) in a year. CNH remains top even though implieds have spiked massively here. (25 delta riskies and ATM)


But when considering that there has been a global pick up in vol, comparing to G10 vol composite, CNH vol is in fact near the lows, and with high carry looks to be attractive. Whether we look to buy spot or take advantage of high implieds / riskies.


There has been discussion of a widening of the trading band from fix +/- 2% to maybe 3% as china looks to float the currency a bit more, but for the meantime, with spot at low levels vs the USD and on a vol adjusted carry basis, CNH looks aight.

Anyway, quick one from me today, been busy at uni... some contradictory trades to themes, but timing as ever is key blah blah blah.

Sunday, 4 January 2015

FX weekly thoughts - Jan 5th

Over the Christmas period, maybe somewhat surprisingly, Investors still loved the USD, it felt as if as we changed over to 2015 speculators just had to own $s, and subsequently, the dollar had one of its best days in a long while (especially vis a vis CAD and GBP, +1.33% and 1.6% respectively)

More interestingly perhaps was the EUR, which traded as low as 1.2001, though this being said, with this much pressure it would seem probable for the (likely) hefty stops below 1.2000 to be tested.

EURUSD daily
We dropped through the 2012 "whatever it takes" low at 1.2043 without much difficulty, leaving the next obvious downside target at 1.1880 or so (2010 low).

We are seeing Record spreads between UST and bunds (or any EUR rate frankly), with the benchmark spread at over 160bps. While I know we shouldn't simply compare yields in different ccys, but its worth reminding that USTs are denominated in USD and Bunds in EURs.

US 10s vs German 10s
So with a hefty yield pickup over bunds, you also get to own USDs over EURs, which to many, given the divergent environment is rather attractive. Furthermore, Whilst this spread may widen further, bunds yields on a fast track to 0% will act as an anchor and will almost certainly drag US yields lower too, and with this continued theme of global disinflation (or at least expectations) the long end will still see plenty of demand.

However, I feel that perspective is certainly needed in the USD rally, while I do believe we head higher, its worth bearing in mind, we are already trading above the median Q1 '15 forecast for the DXY, and its only been one trading day!! On top of this, we are going into a year where it feels like  *everyone* is bullish to quite a large extent... so to be trading above Q1 f'casts and close to Q2s already seems like we may be getting a tad ahead of ourselves

DXY forecasts ranked from high to low for Q1

When we plot the USD against real 5 year rates, we are starting to see a bit of divergence occur, whilst not huge, and similar to what we saw in late sept/oct, it could put the brakes on the rally.


As opposed to looking at the broad dollar, the AUDUSD is seemingly the most sensitive currency to real 5 year rates, with an R^2 of 0.88 as we can see below


While small still, we are starting to see a touch of divergence in the past few weeks, suggesting the AUD could be supported, but when considering other factors (commodity prices, AUD rates) this is only one of a few key drivers, but nonetheless, it at leasts boosts conviction on the relative value AUDNZD, which down to 1.050 is once again at all time lows, which is cheap imo.

One last chart on FX and Real spreads... EURUSD vs. 2's real spread

EURUSD vs. real spread
Once again, it seems the USD may be getting a bit ahead of itself, when considering 2 year real spread.

I may be sounding like a bit of USD bear right now... but don't get me wrong, I can, and am, bullish but I do think that we could be in for some consolidation/pull back. Just think back 1 year, same sentiment as we have now, yet it took 6 months of consolidation before the consensus trade worked. Now I don't think we have 6 months, but until the ECB in late Jan, the USD may struggle to move much higher.

Looking for specifically at the GBP now, and wow its been weak. An illiquid friday in holidays saw a sizeable drop, trading through some large technical levels exacerbating the fall. Now I tweeted a chart like this one last week, and the GBP has been trading rich to rate spreads, and we still are, just less so...


When we look to play the US theme this year, paying the short end really doesn't seem like the best play, while it should work, the yield curve is so steep that a 1y1y fwd is 77bps higher than 1y swap so overcoming the carry will be tough, as such its far more intuitive to play the USD given the probable correlation.

However on the contrary in the UK, As I still am optimistic, shorting rates seems more attractive than trading the ccy. Even though the foot has been taken off the gas somewhat, the key metrics determining BoE policy aren't much different than the Fed. However looking at the short sterling curve you wouldn't have guessed...


Looking at Dec '15, there has been an entire 1 point rally, implying a 100bps lower LIBOR rate for this December, just since June...

A nice, although not totally reliable indicator, is the running sum of economic surprises (as per Citi's CESIs)

The top pane shows the clear slowing down of the UK economic surprise, whilst at the same time there has been a marked pick-up in US activity, a primary reason for the 1.72 -> 1.53 move in Cable, as the UK ticked lower as the US ticked up.

However, we are starting to slowly see a moderate pick up in UK data, and if there is any sort of Core inflation impulse higher, then I am sure we will start to see the hawks re-emerge. As such selling Z 15s here seems good.

A lot of big ticket releases this week from NFP, FOMC minutes, BoE statement, EZ CPI. However I have no clear biases on any of these, looking at some Dec data (globally) it was a tad weak, so maybe downward pressures on NFP (but consensus is only 240k), possibilty of a "deflation" print in EZ CPI after Spain's, but this is all in the estimates and thus shouldn't provoke *much* reaction. It might make for good trading, but is unlikely to change any of my macro biases or really matter.