Pages

Sunday, 26 October 2014

27th October, weekly thoughts

Coming up this week, we've got a few important events - namely the FOMC statement this Wednesday, but also other events such as EZ CPI, RBNZ OCR, Chinese PMIs and the BoJ. This week should be pivotal, and will likely set the tone for the rest of the year, specifically in G10 rates and FX.

Regarding the FOMC, we will see the end to the QE program with another 15bn taper. Discussion around considerable time might arise, however given current market pricing (via FF futures and EDs) it is expected that we have another 11 months until the 1st rate hike.  

MS M1KE
The problem is that the US economy is getting to the point where a rate hike is sensible, no matter how we put it, the recent risks that have developed in the past few months will likely (and hopefully) reside. Whether they be risks from China or Europe, they don't seem enough to really put of US hikes.

However, there is no escaping the fact that Yellen really doesn't want to hike, and there have been a few timely excuses that she will use to push back expectations. Namely weakness in oil prices leading to a drop in inflation expectations, however long term expectations have dropped only marginally. The ECB apparently loves the 5y5y measure, yet I am sure the Fed will forget to mention that long term inflation expectations are stable (ish), but will focus on shorter inflation swaps.

5y5y inflation expectations
Using a Taylor rule estimate for the US fed funds, we can see that even if we were to hike on we Wednesday its still dovish... But I know there are many flaws with a Taylor rule estimate, but I'm just using it to illustrate a point that even if Yellen wants to put off hikes, there will come a time in the not-too-distant future that she will be forced.

Mankiw's estimate for Taylor rule
It is worth bearing in mind the next couple of charts... 

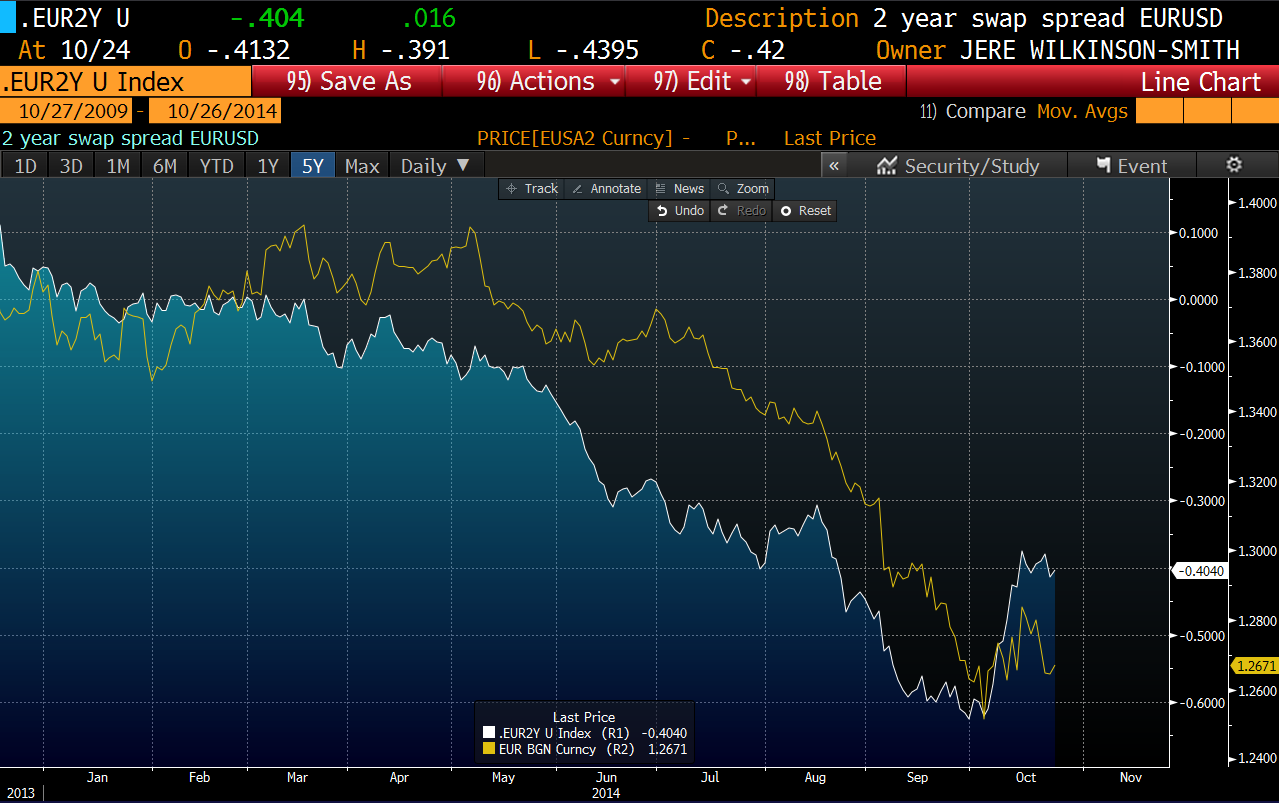
EURUSD against 2 year swap spread
 The EUR still appears cheap to rates, and on the chance we see Yellen make some excuses, the USD is vulnerable to a short term correction towards 1.3000, that is where the pain trade is in the FX markets, and it seems more and more likely.

US 2 year govt bond yield
After the other weeks crazy rates move, US 2's have stabilised, yet are way below where they were, I prefer paying US rates, and shorting the USD, it offers a better risk:reward, and is hedged somewhat into FOMC.

On to the RBNZ and the NZD now... the 90 day bank bill futures see the next hike about 6 months away, however I would be more unsure about that. With NZ's Terms of trade plummeting (milk, innit) and a further slowing down in China, the RBNZ will be hesitant to hike further, and may even be regretting the recent 100bp move given the last CPI print. Either way, hikes are off the table, and it's very likely we don't see another RBNZ hike before the Fed.

90 day bank bill futures curve, now / 1m ago /3mago
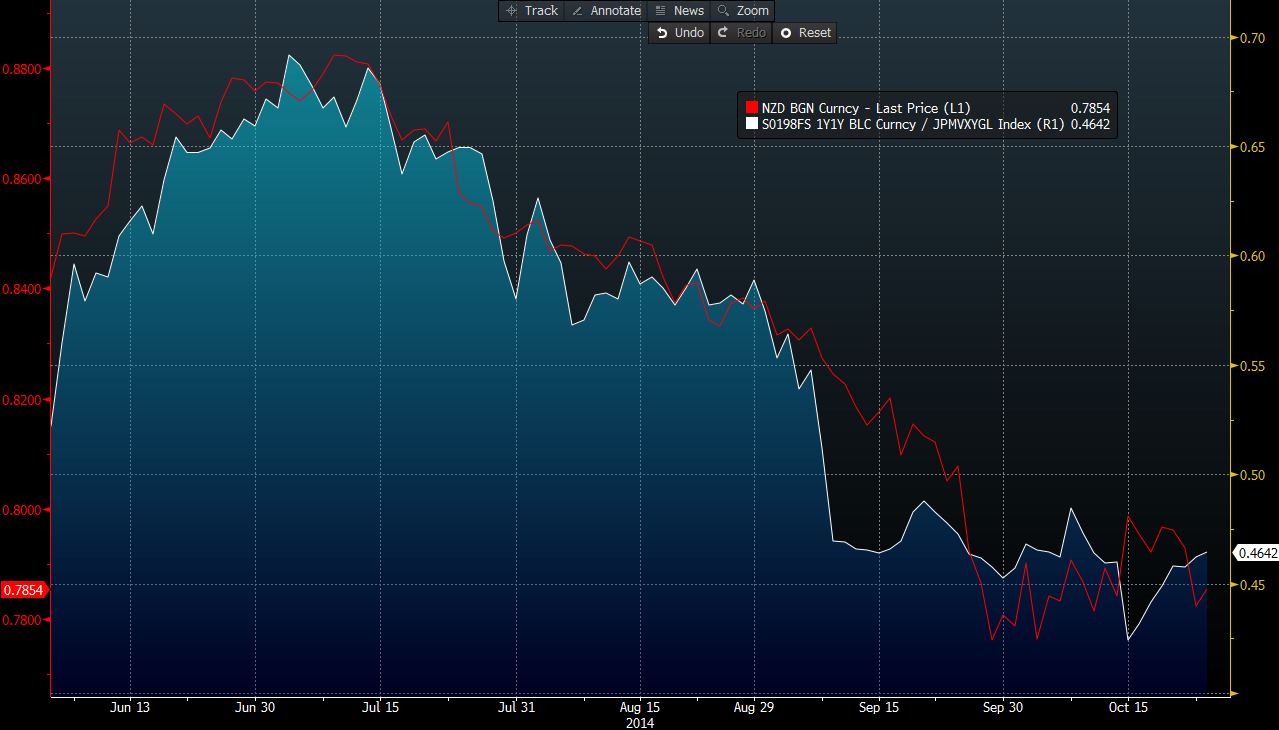
 We can see the drop in rate expectations from the above curve chart for the 90-day bank bill, while not huge, its certainly not insignificant.


NZD vs carry/vol
Here we can see the impact clearly with Carry/vol (1y1y / FX vol). Furthermore, given risks to short run outlooks we should see a pick up in vol further, and combining this with lower NZD rates, the NZD is likely to under perform.

Next up... Brazil, and we have some elections! now I know very little about these, as I haven't been following. But Dilma Rousseff is probably going to win given recent pollings, and options markets have moved accordingly with a sizeable mark up in vols, and 1 weeks still around 40 (as of friday)

USDBRL 1 week ATM vol


The vol surface is interesting too, with very little skew between puts and calls, which is quite odd around risk events!

BRL vol surface

USDBRL

$BRL had gone from being the best performing ccy (carry adjusted) for the year just two months ago, to barely even flat. The sharp sell-off has led some banks to suggest buying, given the "oversold" nature of the BRL currently and the high implied yield from NDFs (just shy of 10%)

However, BRL and BRL options are outside of my investable universe, so I'm just watching, but it's interesting nonetheless.

In $RUB, we are starting to get into that area where I'm going to start looking at the RUB in a constructive way... Implied have spiked higher with 3m ATMs at 15, with 25d riskies at 5. With the RUB firmly in the intervention zone for the Central bank and with plenty of firepower I would expect the large sell-off to start to slow down. 

USDRUB and 2 year swaps top pane, vol and rr's in bottom
 The RUB is incredibly vulnerable and I'm certain weakness in oil prices are not helping, this being said, I am looking to buy (via options) through till year end. (short 45 calls, long 40 puts - taking advantage of skew, whilst long RUB)


RUB 1y xccy basis
Looking at the basis, the $ liquidity problems are still firmly about, however it is starting to come off a little which should take away from the local demand for $'s


Anyway, just some quick thoughts. Have a good week.

Monday, 20 October 2014

On the USD and US rates

Last week we saw quite an incredible move in US rates, it is quite difficult to describe henceI'll let a chart tell the story...
US 10 year yield
We saw a huge move, probably the largest (once adjusted for yield) ever. Nearly everyone I've spoken to since the move last Wednesday that sits on the sell-side said their rates desk got absolutely slaughtered. Especially given the exposures that rates desks can take on, a 3% move in a currency is big... but a 3% move in the price of the US 10 year note is massive - and it hurt a lot of people.

The craziest thing is, that we ended the week only marginally lower from where we opened.

USD 1y1y
The forwards and especially the short end got hit lower and have stayed down, 1y1y has dropped by over 50bps and the expectations of rate hikes from the Fed have been really pushed back... Using Eurodollar futures we can see that the market had pretty much agreed on July 2015. However, one day the market in its infinite wisdom just decided to push that back to November!

CS 1st hike date


However it wasn't just US rates that went a bit crazy, we saw a large move in Peripheral rates too! Italian 2y's also had a busy day on Thursday with yields doubling in a few minutes!


However this does present us with some trade ideas, firstly and simply with the USD. The big event next week is clearly the FOMC statement where we will finally see Yellen's actions. The move in rates must have something to do with how people are perceiving Yellen, however it is still very likely that the QE program will finish, but any discussion about "considerable time" are out of the question it seems.


Currently, it seems after the recent rates move the EURUSD is trading fairly cheap to 2 year spreads, and its perfectly feesible to see a pickup towards 1.300 in the coming weeks.

We've still got extreme positioning, and the USD does seem overextended still (even at 1.28) as I was quoted saying here (http://blogs.reuters.com/global-markets-forum/2014/10/08/fx-musings/)

We were trading around 1.26 then, and I stick with my price target towards 1.30.

One way the Fed could push back expectations is by lowering NAIRU forecasts, possibly to below 5% to buy some time for Yellen to push back rate hikes. This will of course weaken the USD, but I think the bigger question is the disinflation we've seen in 2014 (particularly last few months in 5y5y inflation swaps) a problem for monetary policy? 

I mean, there may be demand issues but given the move in inflation is global and we've seen a large drop in oil/commodity prices, its clear to me that oil prices are in fact impacting monetary policy, or at least market expectations of policy.


This scatter from @boes and @ericbeebo is particularly interesting as it does show the strong relationship between the two.

And assuming that Yellen leans on the dovish side, its a conveniently timed excuse to be even more dovish!


As such I think that Cable offers decent upside along with EURUSD. As we can see from the chart, the 1y1y spread is still important for the pair and this will most certainly continue going forward, but assuming we see some further short term weakness in US yields from a dovish yellen then the USD will weaken and the GBP is already marginally cheap (and heavily shorted).

All in all, we've seen a monster move in rates, and a complete shift in sentiment regarding 2015 and the Fed, however from what I see, its only a transitory thing due to oil/commodity price declines and as such I once again am looking to pay rates, short Eurodollars and buy the USD - just at better prices.

*sorry its a short and quick one with very little detail but I crammed it in (got to study... or something). I will try to write some more / better posts in the future

Monday, 22 September 2014

22nd Sept

It's been hard not to notice the flurry of new EURUSD targets from the sell-side, notably last week with Goldman Sachs targetting an eventual parity (chart). More recently, Citi suggesting the ECB itself is looking for the EUR to drop to the 2012 lows.

We suspect that the ECB is targeting a reversal of the EUR rally that started after the EURUSD hit a multiyear low of 1.2043 in June '12 - Citi


I can begin to see where they are coming from, very simply, if we regress short end rate differentials to the EUR, based on the last few years inter-relationship, then we can somewhat forecast going forward based upon the enormous divergence in monetary policy that will likely play out over the coming years. Of course, the relationship will come and go, US rates won't rise in a straight line and who knows if we ever get that 1st FF hike next year. But either way, its rather clear that, at least from an interest rate perspective, the EURUSD is very susceptible to fall in the coming years.

Using a simple 2y rate model, we can forecast a 1.07 EURUSD for 2 years time, using the spread between 2y2y fwd starting swaps. But like I said, its not going to happen as cleanly as that, but the magnitude of downside isn't *that* ridiculous.

However, I care much more about where the EUR is going in the next few months, not years. So lets look at that.

CESI spread vs 70-day change in EURUSD
 Here we have a chart of the spread between Euro-area and US Surprise indicies, plotted against the 70-day change in EURUSD. The EUR is clearly stretched at current levels, and it would seem that the data flow is starting to edge against further downside.

EUR vs model FV

 And as we can see from this chart, The EURUSD is at extreme "cheap" levels against my FV model, with a sizeable divergence between the two recently. However, as is the case with models, it may stay diverged for a long period of time or the relationship that we've seen over the past few years may dissipate etc. But, it is worthy of note to me.

I still see Sovereign QE as a likely inevitability from the ECB, but not for a while, so until year end I expect little from them. From the fed, the prior FOMC was quite interesting. A hawkish shift in median dots, yet Yellen clearly stated that the Futures market aren't out of line with the dots. Given that they are massively out, we can only draw from that the location of Yellen's projections in the 2016 and 2017 periods (I circled them)


So while we will get a lift-off in rates, It's kinda pointless to look at the "trimmed mean" or median or whatever. Just focus on Yellen's.

2yr futures net positioning (CFTC)
Investors, have flipped to the most short in years for the 2 year futures, so much like with EDs we have an obstacle in our way.

Lastly on the EURUSD, looking at DXY bigger picture.


Trading up against resistance, now is a critical juncture for the USD, and while longer term the picture is clearly bullish, we've had 10 weeks of  advance and no meaningful pullback. A good reason for this really, with this move taking most by surprise, investors are jumping in at even a 50 point pullback so as not to miss the move. In EURUSD, huge selling interest on anything above 1.30, so if we do bounce. It won't be for too long.


On to a little look at some precious metals, we've seen quite a sharp move higher in 5 year real rates. Many expected 0 to at least slow us down, yet we're already 12bps past that now. The outlook for higher real rates also makes sense somewhat, so while we may pullback, it might be shallow.


The relationship with Gold and Silver is very well documented, and well known, and we can see so far this year, the two track each other nicely.

US 5y real rate (inverted) vs Gold
The outlook also doesn't particularly look that pretty in Gold (or silver)


To me, being long XAU vol here seems to make sense. If we break lower than 1200 we're certainly going to trigger a lot of stops on our way down to 1050, if we reverse, investors that have chased this lower against the 1200 level could quickly cover. Hence a 3 month straddle seems pretty attractive to me.

Otherwise, last post for a while (I assume). Moving into uni next week so quiet from me.

Monday, 15 September 2014

16th Sept - FOMC & Scotland

It seems like all of a sudden the discussion around the FOMC (this wednesday) is around the language use, notably the "considerable time" comment, which as Hatzius (GS) points out, is almost an informal 6-month marker from the end of stimulus until the first rate hike, which would point to sometime around March/April '15.

Market estimates see the first hike (taken from fed funds futures) to be between June and Sept... basically, next summer.


Talk about whether we see "considerable time" removed or not is unnecessary at this point, I think what is more important for the fed is to anchor expectations in a more quantitative way i.e. the dots... Currently, the market is behind the last fed dots, and while we could see an "RBNZ" esque move to lower forecasts to current market expectations, I expect no meaningful change (at least in the front end immediate forecasts, we may get some moves further out).

On the other hand, data has been promising, and an argument can be made for June or earlier hikes


By most accounts, the fed is already more dovish than needed (as per taylor rule in 1st chart) and when looking at recent activity indicators from GS, we can see quite an improvement over prior meetings. So we may see upside surprises to the dots.

On the market side, we've seen quite the run up in yields MTD, so in the event of a boring, unchanged fed then Yield curve flatteners may be attractive. Otherwise, I remain short EDZ6 from 98, as even though positioning may be against me, there is significant mis-pricing against the current dots, and any upward moves to rate forecasts from the FOMC would benefit that trade enormously.

US 10's stalling at the top end of this years down trend
A break higher on the back of a marginally hawkish fed would be important as the spill-over effects into G10-carry, EMFX and even credit markets would be significant in the short term.

AUD vs 7 year UST (inverted)
Won't dwell on this too much as we all know the impacts, but here we can see High yield vs 1Yx10Y normalized swaption vol, which will likely rise alongside G10, and especially going into a hiking cycle.

HY vs US 10 year swaption vol

The sell-off in commodities, particularly energy (as its direct impact into CPI) has seen US inflation swap pare their advance, and we've dropped 40bps on the 2 year inflation swap. This has boosted US real yields, which at the same time have been rising strongly. So right now, the strengthening USD has pushed the CRB index lower, which has led to higher real yields and so on etc.

CRB index (red) vs US inflation swaps (2y)


As noted last week, and reiterated today. I am positioned long EURUSD in a zero-cost structure between 1.27 and 1.30 or so. However, short USD works well as a hedge against my rates trades, especially with the extreme moves in the USD currently.

Off course, on to the Scottish independence vote, which the results will drop early Friday morning. Currently based on bookies odds, there is around a 20% chance of a yes majority.

*from Betfair's exchange
This is a relatively low percentage in my books (okay, not compared to a few months ago, but thats not the point. No is still far and away likely).

All over twitter in the past few weeks we've seen plenty of GBP implied vol charts, and we all know its spiked fantastically, with Sep-19th ATMs trading at (mid) 18 vol points on cable.

One thing not overly explored is that of the move in the short dated risk reversals, or even the impact on the curve a long way out.

Looking first at one week 25 delta risk reversals, we can see that it is the most extreme ever (on my data, which doesn't go back to 2008) - at -4.2 vol points!! (EDIT, asked around. Lowest 1 week in 2008 was -3.7, so... yeah more extreme than then)

GBP 25 delta 1 week risk reversals
I can't chart the risk reversal skew for Sep-19th, but as of writing its currently -5.5, So its safe to say that at least in the options market, there is a helluva lot of protection buying going in to Thursday Evening.

The thing is, given my expectations of the vote, I am still not brave enough to sell naked puts (for sep-19th) even if we have an all time high RR skew and a level of implied volatility that won't likely be delivered on the day.

GBP 3 month 25D risk reversal skew
However, I look further out the curve for GBP options (3month charted) and its 2sd wider than its mean, and back to 2011 levels.

So I definitely think, that further out in the curve there are extremes that should be exploited. Maybe not 3 month exactly, merely using that to illustrate how the entire term structure (not just very front end vols) has moved. As per last week, I still like EURGBP double no-touches, a 25delta 3month DNT costs just shy of 20% of notional with barriers at 0.8221 and 0.7786. Last weeks strucuture is doing ok, but spreads are going very wide (up to 3 or 4 vol points) so MTM is not doing as well as I think it will by expiration.

I have done some math & modelling, and I think 1.57 is fair value for cable in the event of a "yes" vote, where as 1.6450 is where I think we trade after "no" (however cable is very much dependent on FOMC, so EURGBP is cleaner to look at for the "GBP". 0.8265 is my EURGBP FV on yes.

Either way, should be a fun friday, but I think "no"


Tuesday, 9 September 2014

G10 overview - Sept 9th

A quick look at some G10 currencies, and some of my thoughts on them, especially as we have started to see the markets liven up a little bit, broadly speaking, Central bank divergences is still the main factor, but we've got plenty more noise around now.

Some generic charts to start with, firstly, 1y1y swap rates for UK, USA and Europe. These (and their inter-relationship) do pretty well to sum up where the FX markets have gone in the past few weeks/months and why.

USD, GBP and EUR 1y1y swaps
Next up, is G10 vol, which will be touched on throughout, but generally speaking we can see how it has bottomed and finally heading higher with some decent traction.

G10 1 month implied volatility composite
Anyway, on to the EUR, which has been very very weak whilst I was away on my travels. ECB cutting rates and looking to boost the balance sheet some €1tn a very good reason for the weakness we've seen, but it seems to a large extent that now the ECB can do little else to weaken the EUR more (which is what they've been doing since 1.40 anyway). As such we need to maintain positive US economic momentum for any further EURUSD weakness.

However, Positioning is now a huge hurdle in the way of sustained weakness... possibly the only realistic one as well. Whether you look at IMM or proprietary data, everyone is balls-deep short the EUR and looking at the charts, the market seems very extended.

A quick look at EURUSD 28 day (1m) RSI shows its at its lowest level since... well before the EUR existed.

EUR RSI extreme
However, its low for a very good reason, and versus my models, there is little in it between fair value and the current spot rate. With diverging rates its no surprise to see this pressure on the EURUSD.

EURUSD vs fair value model
This being said, rates are still likely to continue diverging, the Eurozone economy continues to lag behind the US by a substantial amount and real money flows are strongly biased towards the USD, so while a bounce is likely, expect it to be relatively short lived. We will probably trade the topside of 1.30 again soon, however we may be in for a period of range trading as the market clears out all of the shorts before the fundamentals take over and we head lower again.

My trade (which I don't think that you should follow) is Long 1.3050 2m call, short 1.27 2m put. If we go sideways (as I mostly expect) we are pretty much zero cost. Downside is going to get harder with positioning and techs in the way so we hopefully won't see 1.27 go. On the other hand, if we do see shocks to the current status quo (where-ever they may come from) we may see a short cover rally which we would benefit from.


On to the GBP... one poll suggesting "yes" to be the outcome of the Scottish independence vote on the 18th has certainly stirred up the markets. GBP has *plummeted* (kinda) implied vols have gone nuts and the skew has slammed lower as investors are desperate to buy downside protection, or else they going to look like fools if "yes".

As such, we can see that the premium on GBP 1 month options has risen to a high not seen since the 2010 general election.

GBP - G10 1 month vols
But its not just the very front end (which has inverted out to 4 years), but even 3 month risk reversals have slammed wider, with investors paying a hefty premium for downside strikes

GBP 3 month 25D risk reversal
looking to trade on the back of this might be a good idea, especially on the longer dated tenors, which will more than likely see the referendum effect pass, so downside puts (deep OTM) be pretty attractive to sell... however I would rather wait a few more days for the "yes" hype to build.

As personally I don't see "yes" happening, nor the impact being *huge*... numbers like -5% or -10% are thrown about on the sell-side, but no-one really knows. Uncertainty and the likely push-back from the BoE are sure to weaken the GBP, and right now it still feels like a mass exodus from hefty GBP longs rather than pure speculative shorts, hence, while downside is likely it might not be massive. but a sub 1.60 handle will occur on yes.

On the other hand, there may not be that much upside to a "no" vote. Much of the downside move can be explained from UK rates dropping and "no" doesn't do much to change that.

GBP vs M5 STIR spread
Maybe another way to look at this is the EURGBP, because really, the GBP hasn't been that weak... the USD has just been really strong.

The EURGBP has weakened to levels from two weeks ago... wow.

EURGBP daily

Currently ATM options expiring the 19th trade at 11.5/13.1 vol, with spot at 0.80 (give or take) we have a few options, ideally positioned short vol and also short GBP. As such 0.8150/0.79 sep 19th double no touches currently priced at ~25% of notional.

As such this offers decent risk:reward for the referendum to be a relative non-event, and at the same time see little upside potential for the GBP. Gotta watch that gamma tho.


On to NZD and AUD

The AUD has been performing well, with positioning currently standing at multi-year highs and staying surprisingly robust against the recent DXY rally

from BNPP
The AUD however is vulnerable to a pick up in US rates still, however it seems more sensitive to the longer end of the curve, and need to see US 10's to meaningfully pick up in order to see any sustained weakness from the AUDUSD.

However its neighbour, the NZD, is much more vulnerable in my opinion (not that I'd short here)

With one of the largest net external liability positions, New zealand is at risk from higher funding costs. While that is a way away still, we start to see short end rates pick up as we get closer to this fabled Fed Hike. On the other hand, moving into a hiking cycle should lead to structurally higher levels of volatility, as such carry/vol from NZD should retreat somewhat weighing on the NZD more so.

We can plainly see the importance of g10 vol on the NZD from this daily chart

NZD vs 1 month vol (inv)
So longer out, NZD is tres tres vulnerable, but shorter term it suffers from the same problems that EUR bears face... that positioning is rather short. However selling rallies is definitely something I like. 

With AUD, I think patience is the key.

I've looked at 1/2 of the G10, but thats probably enough as this is getting quite long now... To finish, just some bonus charts that I've got my eye on.


US 2s5s10s
5's looking cheapish here... and work well as hedge against selling EDs. However I don't particularly want to be long 5s into year end by themselves. would rather play the curve, so maybe 5s10s at 75bps

But considering this chart of CESIUSD vs chg in US 10s, I'm starting to think once again that bonds are a tad expensive here

cesiusd vs 70day change in US  10s
US 10 years
Here we have US 10s and QE highlighted... now just a thought regarding Core/peripheral Eurozone rates... do they start to rise on the back of the ECB starting to do something?!?


In other news, off to uni in 3 weeks, unsure as of yet how that affects my twitter/blog flow.