Pages

Thursday, 7 November 2013

Where is fair value?

Well after the ECB rate cut today, I thought I would look at some regressions for the relationship between spot FX rates and respective interest rate differentials

I'll first look at the AUDUSD and will follow the same steps for each FX pair, Firstly here is a chart comparing the AU-US 5 year yield spread to the AUDUSD on an almost YTD look

AUDUSD vs AU5US5 spread
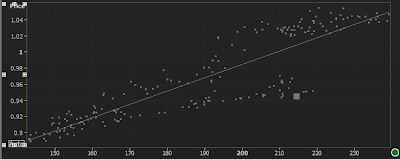
Using this data, when we run it through a regression calculation we see a value of 78% for the R^2, high enough from this one variable correlation to consider useful enough in making a model from it. As such I plotted the respective values and came out with a linear regression which follows the expected idea that higher Interest rate differential (in bps) correlates with a higher AUD


AUDUSD vs AU-US 5yr spread (bps)

Using this R^2 value  we can create a model and below we can see the spread between the interest rate model and the AUDUSD spot price.

Currently, as seen, the spread stands at around 500 pips, or in other words, the AUDUSD is undervalued by 500 pips to its interest rate model (based only on 5 years spreads). In an ideal world we would position ourselves with a mindset to be in a 5yr tightening trade, while also being in a Long AUDUSD trade - if weighted properly then the trade will be hedged and P/L will be defined by the path of the model below.


Now considering other pairs, I'm going to look at the EURUSD vs the 2 year rate differential we get R^2 of merely 54%, however the price feed has a one month break in data which puts of this value, but the divergence is often so small its not noticeable. However if the 2 year rate spread moves to 25bps the model forecasts a rate of 1.285 for the EUR +/- 150 pips as the fair value level. This is currently far below spot market and as such the EUR potentially could fall very far if short term bund yields drop more.

EURUSD vs US-DE 2 year spread (bps)

But throughout the period of the model the divergence has moved much further than 100-150 pips from fair value, but currently the EUR is overvalued by around 350 pips to current fair value (which could drop more after ECB cut)

For the GBP, a view that if rate differentials on the 2 year (currently at 10bps) dropped to 0, then the implied fair value would be 1.5252 with a range based on the standard deviation of the model divergence of 1.55-1.500. With the recent tendency of Mean reversion between UK and US rates this is a distinct possibility until Carney backs down somewhat on Fwd guidance, then the mkt expects UK interest rates to race away from US (by race, like 50bps but yeah) and using the current model would see 1.7230 (but the model changes every day based on price changes so it would be dynamic)

Either way, Interest rates are key in pricing FX rates and as such need to be considered at all times, Above calculations have used relatively recent data but the ideal still holds true.

Friday, 1 November 2013

Market update - ECB in view

If you've followed me for a while on twitter or my daily webinars, it will be no surprise that the ECB could cut rates soon, In fact I've been calling for it since the end of the Summer. But all of a sudden the market finally woke up to the fact the ECB need to do something. Even though 25 bps won't do much to inflation / expectations / growth / unemployment, it will show that the ECB are ready and willing to act to prop up the EZ.

In terms of the options market this drop in the EURUSD was seen by the sharp widening of the 25 delta risk reversal from -0.15 to -0.4 in a short time. The EUR them precedded to drop and the 25d RR stand at -0.788 now.

EUR1MRR (white), EURUSD (purple), EUR 1 week vol - 1 month vol (green)

furthermore a term structure view suggests the market is positioning itself for volatility ahead of the ECB meeting on Nov 7th, and now 1 week vol is 1.6 points higher than 1 month.

These ideas can all be shown together in the Vol surface below


We can see the higher implied volatility in the 1 week than up to 6 months, but in the very short term the 25d risk reversal is small, only getting bigger with time

Today, the expectations of intervention from the ECB grew as credit risk and premiums tightened somwhat across Club Med credit markets.


Here we can see Italian, Spanish and then Portuguese 5y CDS mid spreads today, all down around 10-15 bps on the day.

This came at the same time as Spanish 10 Yrs have dropped to 4%, testing their post crisis lows, and Greek 10 years down to ~8%. Now up 403% in price (ex. coupons) since the Q2 2012 low.

Overall, it would have to seem like the credit markets now expect to see some sort of dovishness from the ECB next week. This comes at a time that the CitiFX economic surprise index for the EZ drops to negative territory


As Barclays FX puts it

"Any month end demand for EURUSD was obliterated by a wall of EURxxx supply as the deflationary issues rear their head and people start to think more seriously about ECB action later on this year or at the start of 2014. Nowotny kicked things off in Asia talking about liquidity provision and EURUSD was lower as stops were triggered down to 1.3688. Swathes of EURGBP and EURCAD supply from spec names kept the headline pair very much under pressure "

The idea that a lot of the move came through the Crosses is seen here through a heatmap of FX volume as seen on the Reuters dealing platform (2nd largest by volume in the world)


All in all, I'd put the chance of a 25bps cut next week at about 30%, with a 50% chance in Dec and then 20% not at all (as per Goldman)

But even though the EUR has dropped, there is still a long way to go to meet 2 year yield differentials

EUR (blue) vs. US/DE 2 year yield spread (green)
- UBS: Now expect 25bp refi rate cut and a 50bp marginal lending rate cut at Nov meeting.
- BAML: Believe ECB will cut refi rate by 25bp next week, but will refrain from cutting the deposit rate. Inflation likely to remain at low levels, therefore no need for ECB to move after next week's cut.
- BNP: Now expect a refi rate cut of 25bp before year-end.
- JPM: Now expect 25bp refi rate cut in December. - RBC: Do not look for ECB to lower rates in the near term.
- Barclays: ECB to remain on hold. Wait for inflation forecasts at Dec meeting.
- CS: Should leave door open for possible rate cut in Dec when 2014/15 inflation forecasts are announced.
- RBS: Now expect 25bp refi rate cut in November, with a 50bp cut in marginal lending rate, while deposit rate remains unchanged.

Tuesday, 22 October 2013

NFP day

NFP Friday Tuesday was today, we saw a print of 148k on estimates of 18k, nowhere near good enough (~200k) change needed to spur on tapering at the moment. On the plus side the Unemployment rate dropped to 7.2% but the headline Sep NFP number was the key, and that came in weak.

The reaction across the markets was entirely predictable, stocks traded higher, bonds traded higher and the USD got slammed across the board.

But, soon after the reading, cross asset correlations started to break down considerably. One of the key determinants of the USDJPY pair is the Interest rate differential between UST's and JGB's. As JGBs are shut, USTs drive the USDJPY price action through the US session.

we can see here the clear divergence post-NFP and we can see my tweet suggesting shorting USDJPY and hedging short USTs


We can see the USDJPY is purple and the US 10 year futures contract (ZN_F) inverted to represent yield, the correlation is normally clear but the divergence was shocking to me.

So as tweeted so shorting both (when weighted properly) would result in a tidy convergence trade, resulting in a 0.3% return, but the advantage here is that this was well hedged against market volatility and represented a great risk-adjusted return.

I suppose the moral here is to follow me on twitter for more simple trades like this :)

Tuesday, 15 October 2013

Trade updates

So my outstanding trades are as followed

Short GBP at 1.6190

Short EUR at 1.3595

Long US-DE 2 yr spread

As of today I've covered the Short GBP to mitigate too much USD risk. And while I'm bearish still, I think taking some off here is decent.


covering at about 1.5920 (horizontal fib level / triple bottom support) resulting in a trade profit of 270 pip profit.

The second trade can be seen here


Entering a "long" spread trade at -0.38 with it now trading at close to -0.25 is working very well, so is the EURUSD which is up about 100 pips currently. And looks like it could go much lower given the right circumstances from Washington

Tuesday, 8 October 2013

Market update 8th October 2013

So today was interesting, at least on the very short end of the yield curve, 1-month T-Bills rocketed as high as as 0.355%, while many are saying this is a rather insignificant move (and it kinda is) it shows how quickly the front end can move, the 1 month benchmark has been stuck to 0% since 2009, and barely budged throughout the European Crisis (ofc) and were only a little weaker during the "fiscal cliff" so in contrast it is quite big.

MTD US 1 month Benchmark yield. Reuters

Notably, the front end of the curve inverted up until about 1Y 9M (the 2yr-1m reached 2bps at one point though!)

US yield curve - Tradeweb

Here we can see the bills yields, the benchmark was up 17bps when this screenshot was taken

UST bills Quote screen. Bloomberg

Furthermore, for the first time, the yield on the US 1 month was > than the 1 Month LIBOR

US 1M TED spread


But these moves higher in US interest rates should be impacting the USD after all interest rate differentials have widened and the 2 Year Soverign spread has moved to 20bps from 12 or so a few days ago. To consider this, the last time the 2 yr spread was at 20 bps the EURUSD traded at 1.3150

EURUSD vs US-DE 2 YR spread

Divergences like this don't tend to last long, and either the US yield is going to drop suddenly(tightening the spread), or the EURUSD is going to drop. Hard.

So here is another look but considering the 2 Yr futures so we can see trade potential

EURUSD vs Bond futures

So here we have the US 2 YR futures contract and the German Schatz future (2yr ish) nominal spread overlayed in green. below we can see a visual representation of the spread by having them overlayed on the same axis.

At a current nominal spread of 0.38 points we are looking to buy US 2's and Short DE 2's. This sythetically puts us "long" the green line.

Simultaneously by shorting the EURUSD we would be hedged against interest rate risk and we would then need to wait for them to converge.

In terms of my weighting I haven't made it a perfect hedge as I have a personal downside bias in the EURUSD. So lets consider how to enter this trade.

Long  1000 TUc1 (US 2 YR) at 110.015

Short 1000 FGBSc1 (DE 2yr) at 110.395

Short EURUSD 1.3595 (Yellen just hit the wires)

Positioned like this, a tightening to 0.20 points would result in profit ~ £201.71 (at GBPUSD 1.6083 and EURGBP 0.8438) , at 0.30 points it would be £128.21

Now we need to consider the EURUSD position at this point a €10,000 notional short from mkt (#spot ref 1.3570) , yielding $1 (0.62.2p) per pip would result in a profit of $300 (~£190) if/when the EURUSD dropped to 1.3295.

If the trade worked perfectly then I believe as opposed to a simple meet-in-the-middle idea the EURUSD drops to catch up with yields then the rough area of conjoining would be ~ 1.327 or 0.30 points at this scale. 

Resulting in a profit or £390 or so depending on GBPUSD fx rate. This is a simple look using 1 contract in the future and a 10k short in the EURUSD but can easily be scaled up and adjusted depending on bias.

Worst case, the spread between the EUR and the 2Yr sov spread widens. 

Roughly speaking if it widens to 0.5 points then the potential loss is ~£150 although this would imply a EURUSD of 1.2970, the EURUSD needs to be below 1.3345 for the trade to BE, so it can be seen that I've quite substantially weighted towards the EURUSD as opposed to the spread. 


Monday, 30 September 2013

Short GBP?

The UK macro picture has improved hugely in the past 6 months, forcing interest rate expectations up hugely as shown by the shift in 3M LIBOR expectations.

UK historical STIR curve from Jan vs real time and spread in red.
This view is supported by the very strong PMI readings and decent labour market readings, all in all the near 10% rally in the GBPUSD over the past 2.5 months has had a strong macro footing, However I see it unlikely to keep pace and there are starting to be signs from the Credit markets that this is the case.

GBP technical view, Citi Macro surprise middle pane, Stochastics bottom.
Here we can see that the GBP is running into 5 year resistance and strong supply above 1.62 through 1.6250 and this will definitely slow progress higher, this combined with overbought stochastics suggest upside is limited for now.

There was also very large volumes in GBP today (possible distribution top?)

Reuters Matching relative volume


This week we have important PMIs and I have a feeling that they'll disappoint, especially considering their strength of recent months that sort of momentum will be hard to keep.

Furthermore the aforementioned Credit view is seen here, the GBP vs (UK vs. US) yield curve spreads

GBP vs GBP model, large divergence occurring now

As we can see there is a lot of resistance for the GBP and the path of least resistance is lower - plus I don't mind holding long USD at this point, so that's why I'm in GBPUSD shorts as opposed to EURGBP longs.

Here is a quote from a Goldman Trader on today's Moves

"The most widely telegraphed flow of the year later this afternoon and no surprise cross trades softly - aided by the general risk off tone and political instability (although hardly new) in Italy over the weekend. My inclination tells me cross won't collapse from here and if anything we should be looking to reduce longs in sterling at these levels - cable should struggle to break 1.62 while EURGBP, although technically looking vulnerable below 0.8350 has severe snap back risk later today with month end also confusing the issue. We still like sterling but not at these levels and the easiest trade right now feels to observe and wait but risk reward here and now is to be short sterling tactically."

My trade is as follows - Short GBPUSD at market 1.6190. SL on a close above 1.63 with targets around 1.59


In other news.... BTPs had an exciting day lol


Wednesday, 18 September 2013

Big moves in the Fixed income markets

So the headlines were as follows from the FOMC

*FED SAYS ASSET PURCHASES ARE NOT ON A PRESET COURSE AND FED DECISION ABOUT THEIR PACE REMAINS CONTINGENT ON ITS ECONOMIC OUTLOOK, LIKELY EFFICACY AND COSTS

*FED SAYS TO KEEP BUYING $85 BILLION IN BONDS PER MONTH, SPLIT AS $40 BLN MBS AND $45 BLN TREASURIES

* FED SAYS TO KEEP FED FUNDS 0-0.25 PCT AS LONG AS JOBLESS RATE ABOVE 6.5 PCT

*FED SAYS RECOGNIZES INFLATION PERSISTENTLY BELOW 2 PCT COULD POSE RISKS TO ECONOMIC PERFORMANCE, BUT ANTICIPATES INFLATION WILL MOVE TOWARD OBJECTIVE OVER MEDIUM TERM  // hints of Japan?

Either way - what we got here was far wide of consensus which was for a $10bn cut in tapering split equally through MBS' and UST's. But this is clearly not going to be considered until December now.

First off, clearly UST's were going to benefit hugely and we saw the 5's yield drop the most (in terms of bps) since March 2009


And, in my opinion, more importantly the US 2s10s tightened from ~250bps down to 235bps on the news as the long end was heavily bought, but at the same time the US 5s30s steepened considereably from 218bps to over 232bps


Furthermore in terms of inflation protected bonds - these were very sought after with the 10's ending up over 2%, pushing the yield down from 0.72% to 0.49%


Overall, it's been a big day and in all honesty, with 2 months to go before the next taper consideration, we could very easily see the 10Y benchmark trade lower towards 2.5%