Pages

Saturday, 31 January 2015

February - FX and rates thoughts

Since my last blog post, we've seen a lot occur in the markets. In what was probably the most interesting month since the euro crisis of 2011/2012. We've had more than a lot of policy action, with Surprise cuts from Canada, Denmark, the move from the SNB and of course ECB QE to name just a few.

What is still being banked on across the financial markets, especially FX is the divergence of monetary policy, most clearyl visualized with the 1y1y USD and EUR rates charts as below.

USD vs EUR 1y1yf rates
However what is evident in the long end, and is becoming more evident in the rhetoric from central banks is that the doves are really acting as anchors... And while we've banked on this divergence, it may be far more difficult to materialize.

If we look at 5y5y rates, a basic proxy for terminal rates we can see that, yes while USD and GBP rates are higher, they are being dragged lower by those of Europe etc.

USD, GBP and EUR 5y5yf rates
Thus far, the impact has really only been on long end rates with investors obviously demanding USD rates at 160bps over EUR ones and therefore as EUR rates drop, there is a constant bid underneath USTs. Not only this, but for every down tick in the USD international investors will look to USTs and thus there is a lot of support / interrelationship, even if there is a so called divergence.

But bringing it back to central bank rhetoric, the FOMC mentioned how it has increased its attention of international developments, be it economic data or policy. As such, while the short end may still be chasing this dream of a 2015 divergence, in reality it may be far harder than we first thought.

There has been an uptick in market expectations for inflation across the world, and this seems simply as the last hurdle to overcome before we have hikes, however given the recent central bank action, I am finding it harder and harder to believe the Fed will (or even can) hike rates this summer, with Sept/Dec being far more likely to me.

However this, I think, is probably a transitory reaction function to global central banks - and the fundamentals still remain in tact, so a later / faster hiking cycle is what I look for.

Short sterling vs ED curve


As we can see here, we have Short sterling and Eurodollar curve between M6 and M8, both of which are incredibly flat. EDs back to 2012 flats and SS even flatter!

However, given the fundamental picture that remains in both countries, with strong labour markets / growth prospects and wages being the key drawback - steepeners on both I believe will work. However timing this is key, because so long as people are receiving the long end, this curve will get flatter and flatter, and right now everyone and their dog is loving duration (with good reason), however this a different trade that is just being pushed in the same direction by the flow.

So I've so far argued that the US is less likely to hike given the RoW, but at the same time suggested a steepener.. hmm... contradictory, but like I said, not entering just yet...

Short sterling curve vs 6mo ago
Pretty much every sector of the SS curve is >1% lower than where it was 6 months aog, and there is just over 50bps worth of hikes priced in between summer '16 and '18 which seems to little.

In FX land, the GBP is still being ruled by rate spreads, in a model with variables that haven't been updated in a year now, and still going strong. The biggest variable in this is the 1y1y spread.
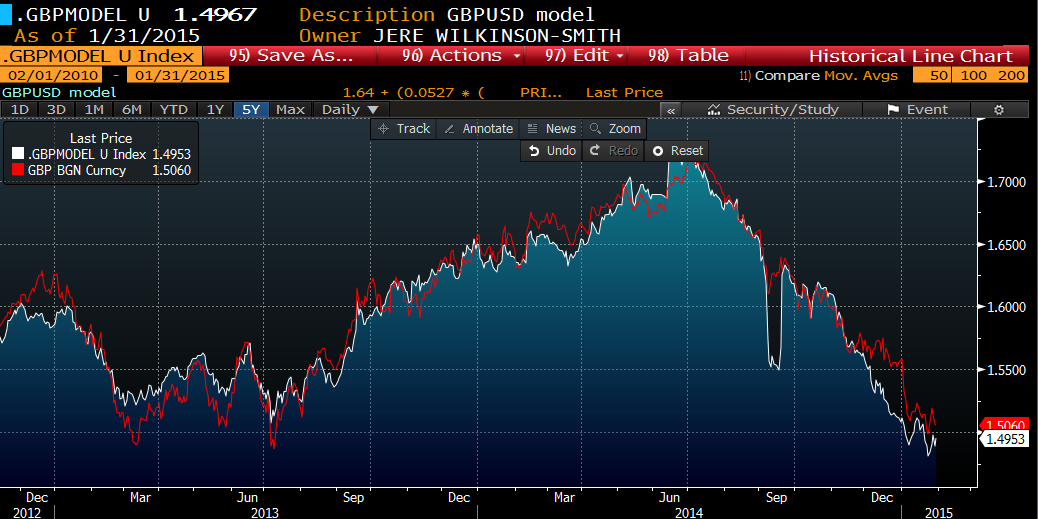
GBP vs model FV
Looking at the EUR, this chart from @Fwred (from credit agricole) shows the resulting move in FX after a QE announcement.


I like this chart a lot, as one would expect the ccy weakens into the announcement, but in 3 of 4 cases (this doesn't include GBP, which in 2012 also rallied post BoE) the currency started to appreciate over the coming couple of months.

EUR-US CESI and EU/US equity ratio
Looking at this picture, we can see that for that European economic surprises have overtaken US ones, potentially the tide is turning somewhat with a possible acceleration from Europe later on in the year and a cooling off in US (much like what happened in the UK!!)

On top of this we see the relative equity performance between Europe and the US, which might result in EUR inflows which was a major factor supporting the EUR in the 2012/14 rally.

So the EUR... reasonably cheap right now, but it is still dangerous to short the USD even if it is getting (wayyyyy) ahead of itself. But 1.20 seems possible to me.

JPY vs nikkei
Therefore looking to fund long EUR in JPY, as currently JPY is a touch expensive to the nikkei at the moment, and coiling for a potential leg higher. EURJPY trades jsut above 130 and to me is good value for longs.

The Bank of Canada shocked us all with a rate cut, though in hindsight, much like Norway seems to make sense with weakening fundamentals and the immense drag of drastically lower (and still falling) oil prices. The CAD has reacted as expected, but it's not something I am willing to to fade, as against rate spreads its perfectly fair.


However, looking at the AUD, we've a tad divergence occuring. In this case the long standing correlation between AUDUSD and 5yr us real rates


Has suddenly diverged...


AUD rates has been heading lower, with the market definitely pricing in rate cuts from the RBA, the recent rhetoric from the RBNZ has flipped from hawkish to perfectly neutral with the 90 day bank bill futures curve flat out through 2017 at 3.5%

It would not overly surprise me to see a rate cut from the RBA, but house price growth is a big consideration here, in any case, vis a vis the USD and JPY I do think that the AUD is getting to be decent value especially as this divergence highlighted above grows... AUDNZD is still a favourite of mine.

Finally a little bit on EMFX, not my strong point, but noticing a few differences in the recent sell-off as opposed to older ones. Spot EMFX is trading lows (as per JPM index), and especially noticeable weakness in TRY / MXN. However, looking at rates, most likely due to the drop in global inflation / core DM rates, we've seen Turkey, SA rates drop meaningfully etc, but unlike other times, the demand in bonds is not at all reflected in a strong ccy.

USDTRY vs 10s
As we can see, in the past TRY sell offs we saw yields spike along side, yet in this case the opposite is occuring for the reasons mentioned above. But the currency is selling off for a reason... and problems exist in EM, however with global funding rates dropping the impact of higher rates is being pushed further back, and as such it might not be that unwise to look to EMFX.

A similar picture in South Africa,

$ZAR vs 10s
This historical picture shows the correlation, but currently $ZAR spot trades 1 big figure higher, whilst rates are 1 big fig lower at 7.1%, thus another sizeable divergence. Considering the supporting factor from lower US / core DM rates, it looks reasonably attractive.


However both ZAR and TRY are at their least attractive levels (based on carry/vol) in a year. CNH remains top even though implieds have spiked massively here. (25 delta riskies and ATM)


But when considering that there has been a global pick up in vol, comparing to G10 vol composite, CNH vol is in fact near the lows, and with high carry looks to be attractive. Whether we look to buy spot or take advantage of high implieds / riskies.


There has been discussion of a widening of the trading band from fix +/- 2% to maybe 3% as china looks to float the currency a bit more, but for the meantime, with spot at low levels vs the USD and on a vol adjusted carry basis, CNH looks aight.

Anyway, quick one from me today, been busy at uni... some contradictory trades to themes, but timing as ever is key blah blah blah.

Sunday, 4 January 2015

FX weekly thoughts - Jan 5th

Over the Christmas period, maybe somewhat surprisingly, Investors still loved the USD, it felt as if as we changed over to 2015 speculators just had to own $s, and subsequently, the dollar had one of its best days in a long while (especially vis a vis CAD and GBP, +1.33% and 1.6% respectively)

More interestingly perhaps was the EUR, which traded as low as 1.2001, though this being said, with this much pressure it would seem probable for the (likely) hefty stops below 1.2000 to be tested.

EURUSD daily
We dropped through the 2012 "whatever it takes" low at 1.2043 without much difficulty, leaving the next obvious downside target at 1.1880 or so (2010 low).

We are seeing Record spreads between UST and bunds (or any EUR rate frankly), with the benchmark spread at over 160bps. While I know we shouldn't simply compare yields in different ccys, but its worth reminding that USTs are denominated in USD and Bunds in EURs.

US 10s vs German 10s
So with a hefty yield pickup over bunds, you also get to own USDs over EURs, which to many, given the divergent environment is rather attractive. Furthermore, Whilst this spread may widen further, bunds yields on a fast track to 0% will act as an anchor and will almost certainly drag US yields lower too, and with this continued theme of global disinflation (or at least expectations) the long end will still see plenty of demand.

However, I feel that perspective is certainly needed in the USD rally, while I do believe we head higher, its worth bearing in mind, we are already trading above the median Q1 '15 forecast for the DXY, and its only been one trading day!! On top of this, we are going into a year where it feels like  *everyone* is bullish to quite a large extent... so to be trading above Q1 f'casts and close to Q2s already seems like we may be getting a tad ahead of ourselves

DXY forecasts ranked from high to low for Q1

When we plot the USD against real 5 year rates, we are starting to see a bit of divergence occur, whilst not huge, and similar to what we saw in late sept/oct, it could put the brakes on the rally.


As opposed to looking at the broad dollar, the AUDUSD is seemingly the most sensitive currency to real 5 year rates, with an R^2 of 0.88 as we can see below


While small still, we are starting to see a touch of divergence in the past few weeks, suggesting the AUD could be supported, but when considering other factors (commodity prices, AUD rates) this is only one of a few key drivers, but nonetheless, it at leasts boosts conviction on the relative value AUDNZD, which down to 1.050 is once again at all time lows, which is cheap imo.

One last chart on FX and Real spreads... EURUSD vs. 2's real spread

EURUSD vs. real spread
Once again, it seems the USD may be getting a bit ahead of itself, when considering 2 year real spread.

I may be sounding like a bit of USD bear right now... but don't get me wrong, I can, and am, bullish but I do think that we could be in for some consolidation/pull back. Just think back 1 year, same sentiment as we have now, yet it took 6 months of consolidation before the consensus trade worked. Now I don't think we have 6 months, but until the ECB in late Jan, the USD may struggle to move much higher.

Looking for specifically at the GBP now, and wow its been weak. An illiquid friday in holidays saw a sizeable drop, trading through some large technical levels exacerbating the fall. Now I tweeted a chart like this one last week, and the GBP has been trading rich to rate spreads, and we still are, just less so...


When we look to play the US theme this year, paying the short end really doesn't seem like the best play, while it should work, the yield curve is so steep that a 1y1y fwd is 77bps higher than 1y swap so overcoming the carry will be tough, as such its far more intuitive to play the USD given the probable correlation.

However on the contrary in the UK, As I still am optimistic, shorting rates seems more attractive than trading the ccy. Even though the foot has been taken off the gas somewhat, the key metrics determining BoE policy aren't much different than the Fed. However looking at the short sterling curve you wouldn't have guessed...


Looking at Dec '15, there has been an entire 1 point rally, implying a 100bps lower LIBOR rate for this December, just since June...

A nice, although not totally reliable indicator, is the running sum of economic surprises (as per Citi's CESIs)

The top pane shows the clear slowing down of the UK economic surprise, whilst at the same time there has been a marked pick-up in US activity, a primary reason for the 1.72 -> 1.53 move in Cable, as the UK ticked lower as the US ticked up.

However, we are starting to slowly see a moderate pick up in UK data, and if there is any sort of Core inflation impulse higher, then I am sure we will start to see the hawks re-emerge. As such selling Z 15s here seems good.

A lot of big ticket releases this week from NFP, FOMC minutes, BoE statement, EZ CPI. However I have no clear biases on any of these, looking at some Dec data (globally) it was a tad weak, so maybe downward pressures on NFP (but consensus is only 240k), possibilty of a "deflation" print in EZ CPI after Spain's, but this is all in the estimates and thus shouldn't provoke *much* reaction. It might make for good trading, but is unlikely to change any of my macro biases or really matter.